1 Why VibeTest
Every team knows it should test more. But automated tests are expensive to write and maintain, and manual testing doesn't scale. VibeTest takes a different path: describe the test in plain English on the Jira issue, and an AI agent runs it for real — on your own machine.
Tests anyone can write
Author tests in plain English or Given / When / Then — right on the issue. Product managers, QA, and analysts write tests without waiting on engineers or learning a framework.
Tests live where the work lives
Tests attach to the Jira issue they verify — not a separate tool. Requirement, test, and result sit together, so traceability is automatic and nothing drifts out of sync.
An AI agent does the running
The agent reads your scenario and drives the real app, adapting to the screen in front of it instead of replaying brittle, hand-recorded selectors that break on every redesign.
It runs on your machine
Execution happens on your own machine — Mac or Windows PC — with your AI agent. Your source code, logins, internal sites, and test runs never leave your laptop; Jira only ever receives the result.
How it compares
VibeTest sits between the worlds of manual QA and heavyweight test automation — and sidesteps the usual trade-offs of each.
| Approach | Who can write tests | Where tests live | Where it runs & your data |
|---|---|---|---|
| Manual QA | Anyone — but slow and repetitive | Docs or a test-management tool | A person re-clicks every release; nothing is automated |
| Coded automation Selenium · Cypress · Playwright |
Engineers only | A separate code repository | Your CI servers; brittle selectors need constant upkeep |
| Cloud AI test runners | Mixed | The vendor's dashboard | The vendor's cloud — your app and data leave your network |
| VibeTest this app | Anyone, in plain English | On the Jira issue itself | Your own machine, your own agent — nothing leaves your computer |
Because an AI agent interprets each step against the live app, a button moving or a label changing usually doesn't break the test — the agent adapts. When something genuinely needs updating, you edit a plain-English sentence, not a page-object or a CSS selector.
VibeTest runs through the AI coding agent you choose — Claude Code by default, or any CLI agent you configure (see Use the desktop app). You control the model, the cost, and the environment; there are no per-run cloud-execution fees.
Who it's for
- QA & test engineers who want coverage without maintaining a fragile automation suite.
- Product managers & analysts who can finally write executable acceptance tests in the language they already use.
- Developers who want a fast, AI-run check attached to the issue — using the agent and machine they already trust.
- Security-conscious teams who can't send their code or data to a third-party testing cloud (see Security & privacy).
2 How VibeTest works
VibeTest has two halves that work together: a Jira app where you write and review tests, and a small desktop app on your own computer that actually runs them with an AI agent.
VibeTest (the Jira app)
Two places to work: a panel on every issue for tests tied to that issue, and a project-level Test Library page where all your tests live, group into plans, and run under one monitor. Write in Given / When / Then or plain English, press Run test, and watch results appear step by step.
AppDash AI Link (the desktop app)
A free app for macOS and Windows that you pair once with your Jira site. It picks up the tests you launch, runs them through an AI coding agent (Claude Code by default), and reports the verdict back to Jira.
The end-to-end flow
When you press Run test in Jira, here is what happens behind the scenes:
The test runs on your machine, using your AI agent and your local environment — so it can reach internal sites, use your logins, and keep credentials on your own computer instead of in the cloud. Jira only ever sees the result.
What you need
- A Jira Cloud site with the VibeTest by AppDash app installed (ask your Jira admin if you don't see the panel on issues).
- A Mac or a Windows PC to install the desktop app on:
- macOS 13 Ventura or later — a single universal build for Apple Silicon and Intel.
- Windows 10 or 11, 64-bit (x64).
- An AI coding agent installed on that machine. VibeTest uses Claude Code by default; you can point it at others (see Use the desktop app).
The rest of this guide walks through it in order: install the desktop app, pair it with Jira, then create, run, and review your first test.
3 Install the desktop app
Everything runs through AppDash AI Link, the free desktop companion. Install it first — you'll pair it with Jira in the next step.
-
Download the app.
Open appdash.ai/download — the page detects your operating system and offers the right build. You'll also find this link inside Jira — in the VibeTest panel's empty state (Download →) and on the pairing page (Download now →).
Platform You get Requires macOS An Apple-notarised .dmg— one universal build for Apple Silicon and IntelmacOS 13 Ventura or later Windows A signed Setup.exeinstaller (64-bit)Windows 10 or 11, 64-bit -
Install it.
On macOS: open the.dmgand drag AppDash AI Link into your Applications folder, then launch it. On first launch macOS may ask you to confirm you want to open an app downloaded from the internet — choose Open.
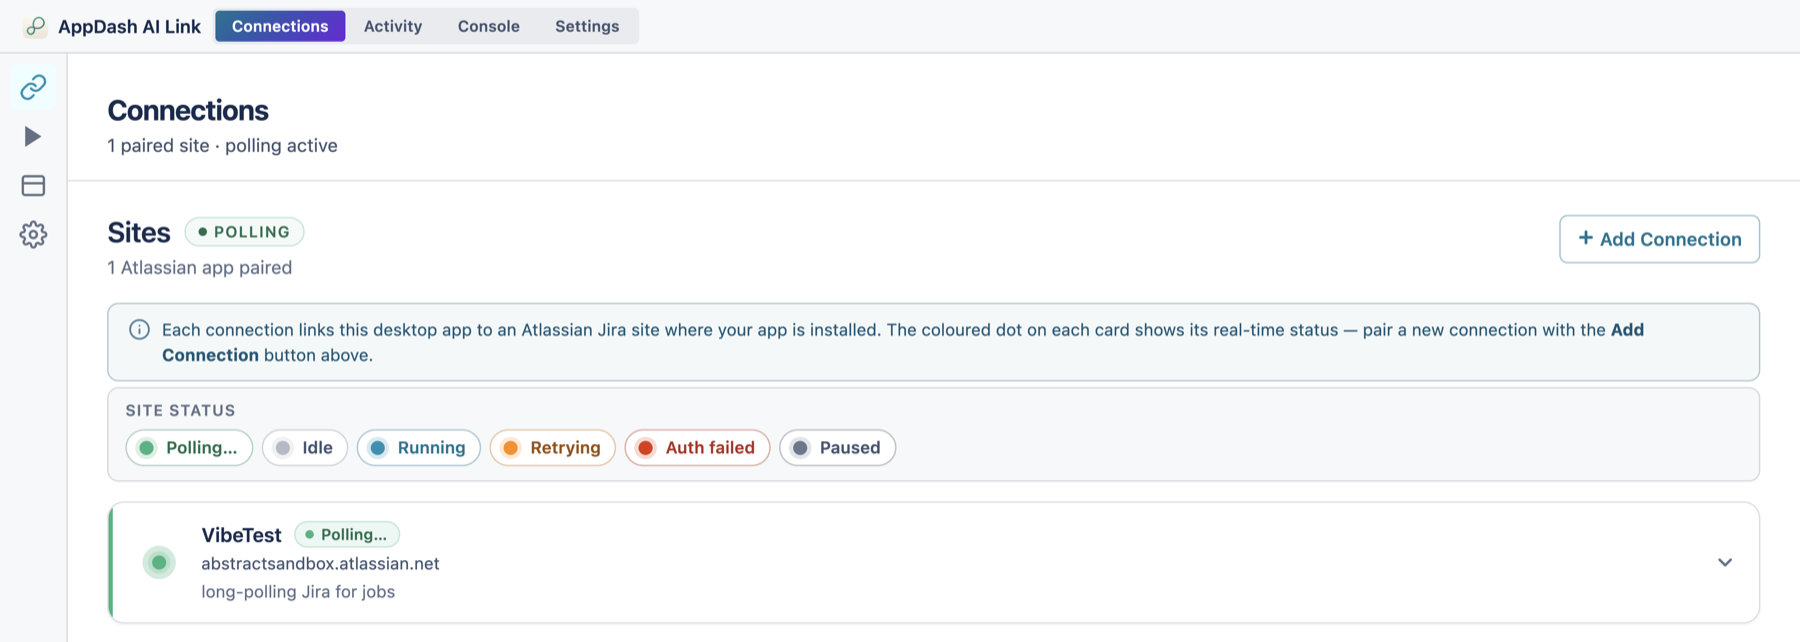
On Windows: run the downloadedSetup.exe. It installs for the current user — no administrator rights needed — and launches when it finishes. - Find it in your menu bar or system tray. AppDash AI Link lives in the macOS menu bar or the Windows system tray, and opens a single window with four tabs: Connections, Activity, Console, and Settings. It opens on the Connections tab.
VibeTest runs tests through an AI coding agent on your own computer. If you haven't already, install Claude Code (the default). The desktop app auto-detects it; you can check or change this under Settings → Agents (covered in section 14).
4 Pair your computer with Jira
Pairing links one Jira site to your desktop app, so runs you launch in Jira reach your computer. You do it once per site, across two windows — the VibeTest settings page in Jira and the desktop app — confirming a short code on both so nobody can pair without your approval. Jira walks you through four stages: Generate → Send to desktop → Confirm → Connected.
-
Open the Connections page in Jira.
In Jira, go to Project settings → Apps → VibeTest by AppDash. The Connections page lists any desktops already paired to this project, and is where you pair a new one.
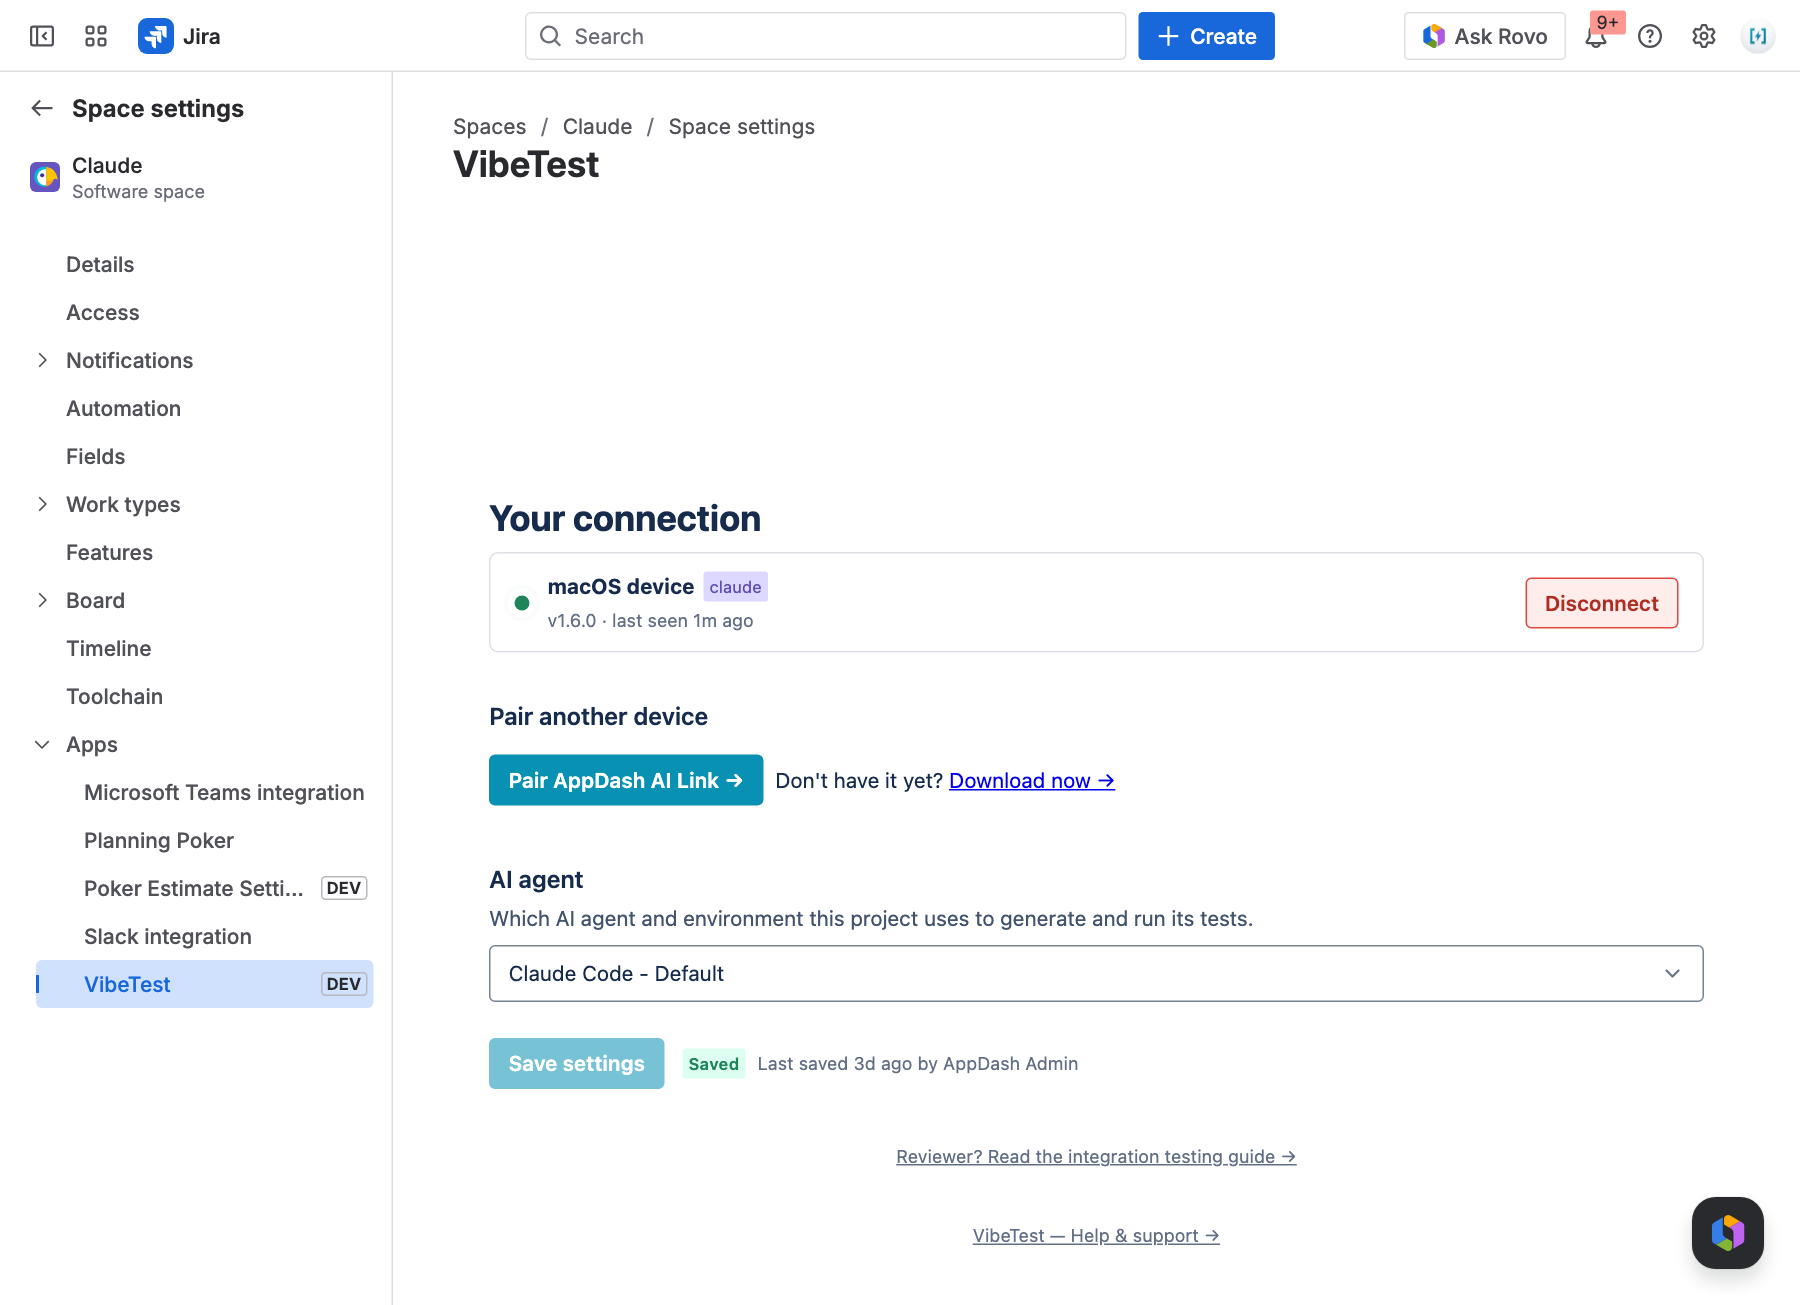
Project settings → VibeTest by AppDash → Connections. Click Pair AppDash AI Link to begin. Don't have the app yet? There's a Download now → link right here. -
Generate the pairing link in Jira.
Click Pair AppDash AI Link. Jira advances to Send to desktop and shows a short user code (note it — you'll check it in step 4) and a Copy pair link button. Click Copy pair link.
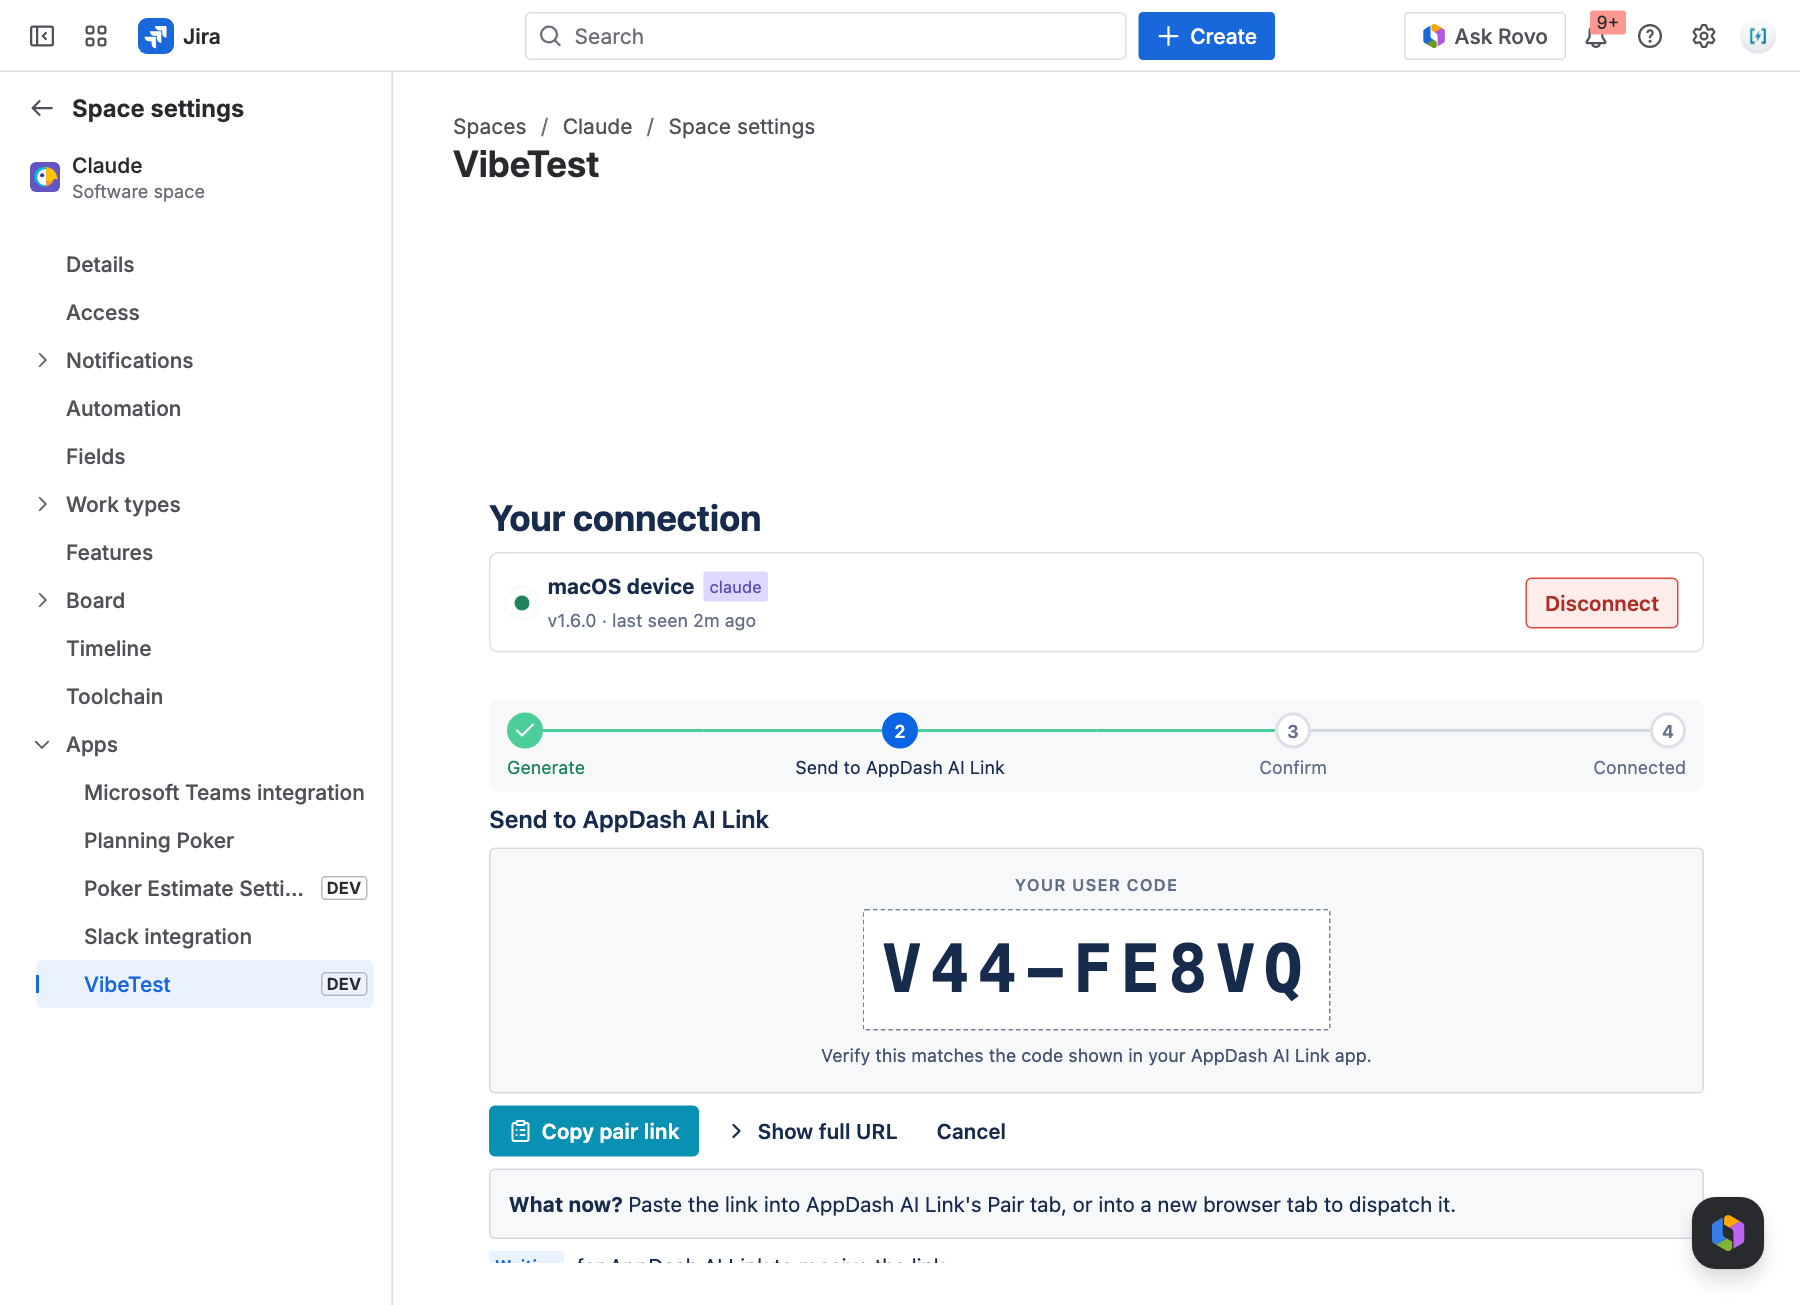
Send to desktop. Jira generates a one-time link and a user code (here V44-FE8VQ). Copy the link — it's only valid for a few minutes. -
Paste the link into the desktop app.
Switch to AppDash AI Link. On the Connections tab, click + Add Connection, paste the link into the box, and click Pair this device.
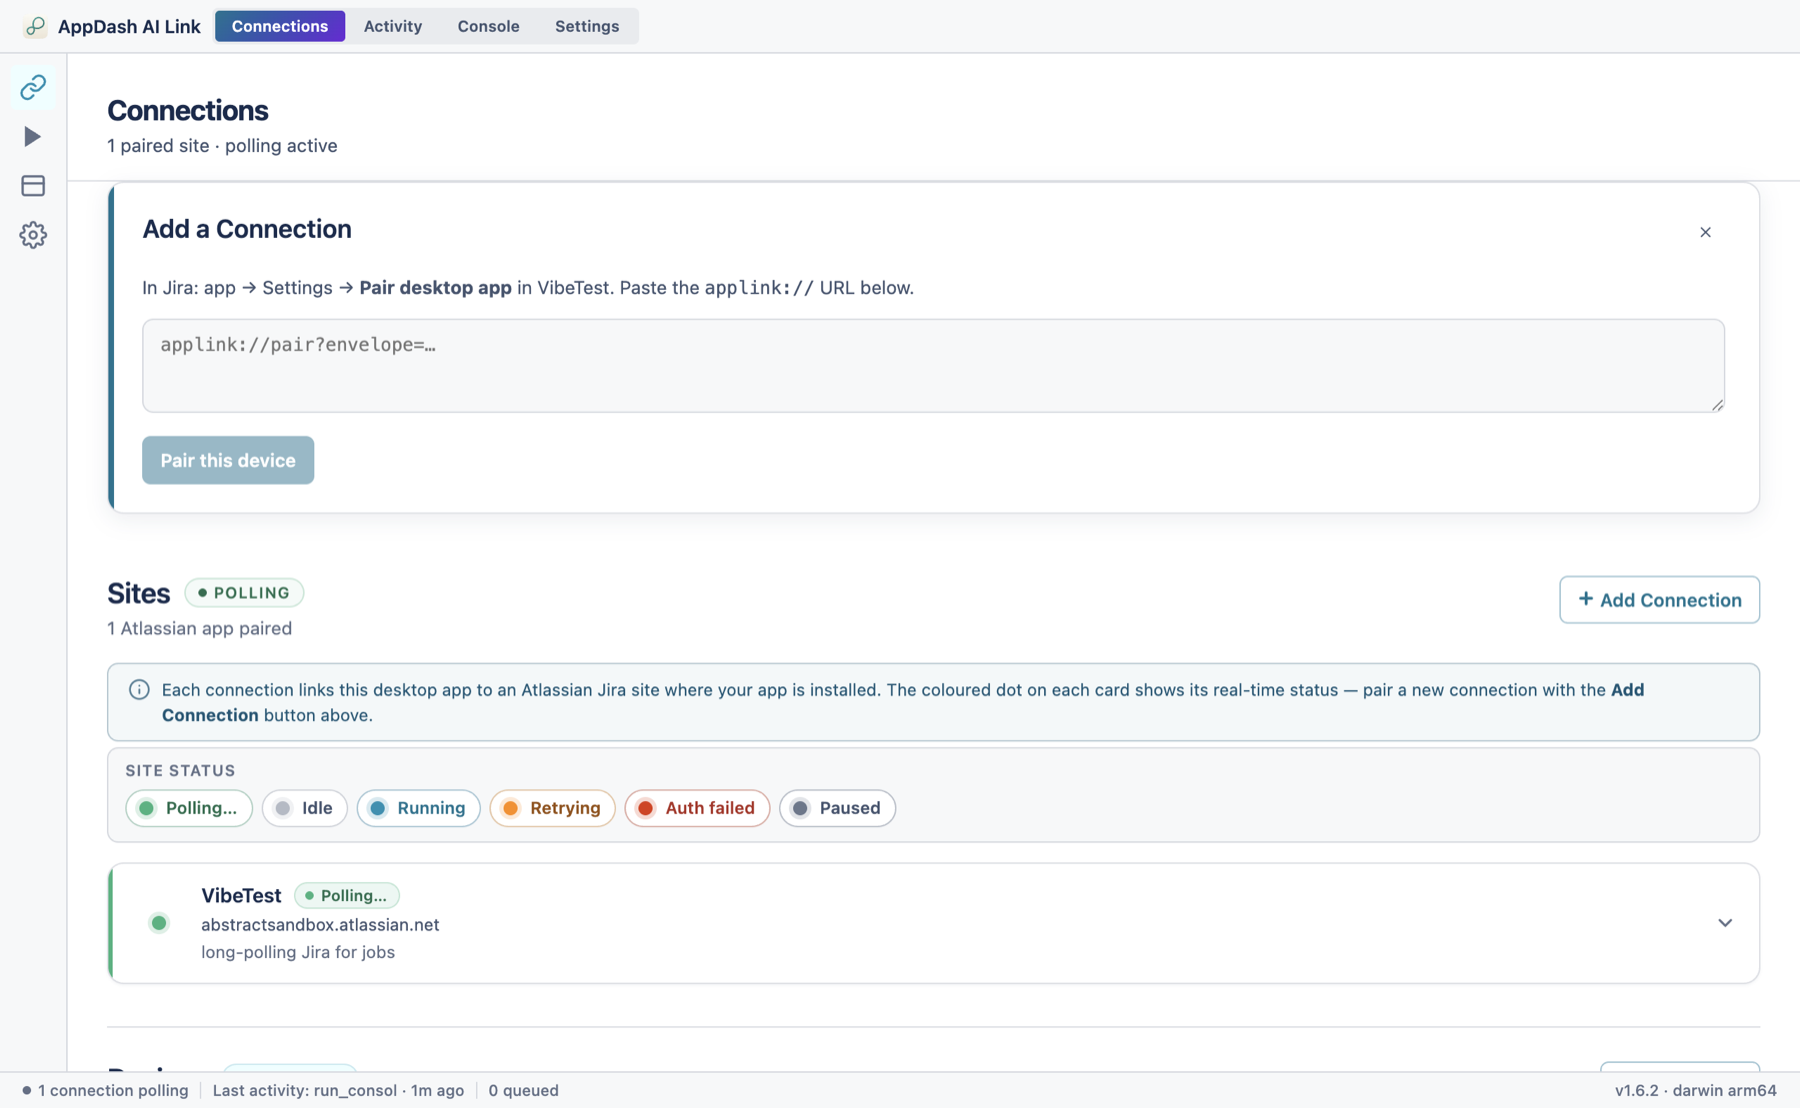
Add a Connection in the desktop app — paste the link Jira gave you, then click Pair this device. -
Check that the codes match.
The desktop now shows "Pairing in progress" with the same user code plus an app fingerprint. Confirm the user code matches the one Jira showed in step 2 — this is the security check that proves you're pairing the right machine.
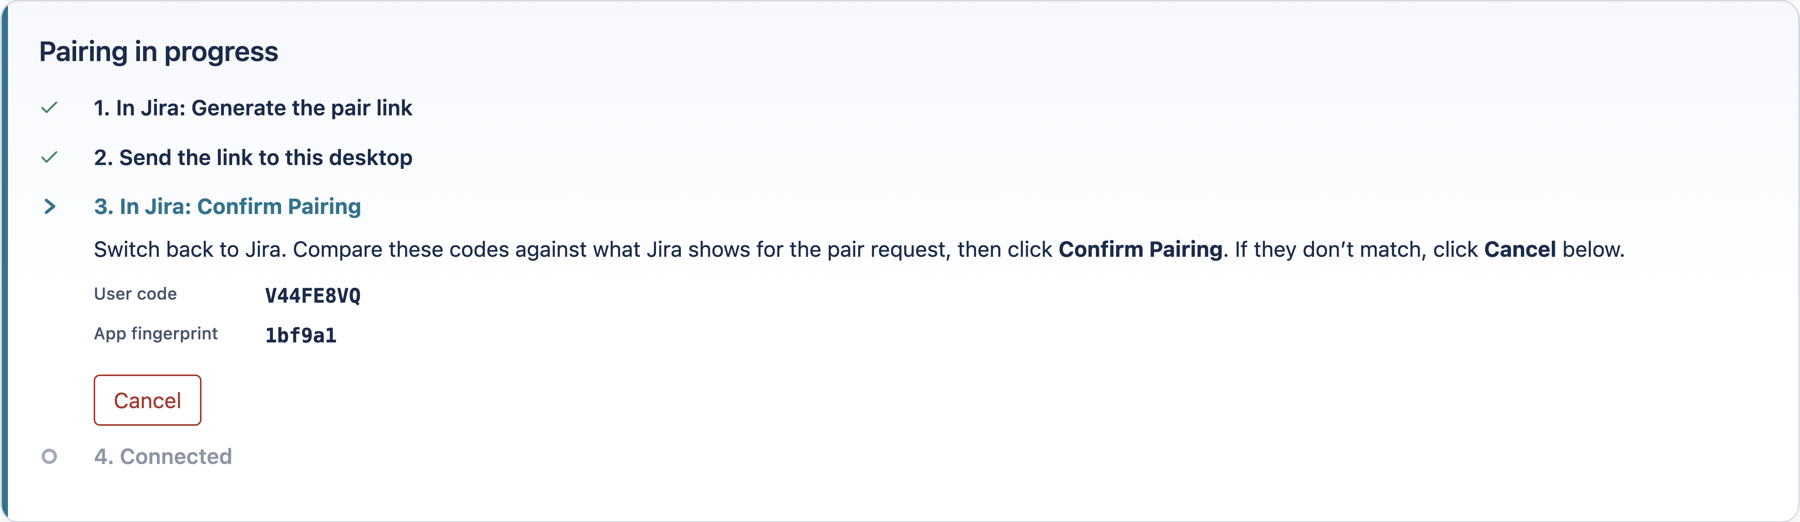
Pairing in progress. The desktop shows the matching code ( V44FE8VQ— same as Jira'sV44-FE8VQ) and asks you to confirm back in Jira. - Confirm in Jira — you're connected. Back on the Jira page, with the codes matching, click Confirm pairing. The tracker advances to Connected, and the desktop's Connections tab shows the new site under Sites with a green Polling dot. Your computer is now listening for test runs from that site.
Pairing links expire after a few minutes. If you see "The pairing code expired" or "signature invalid," generate a fresh link in Jira and paste the new one. If a connection later shows Auth failed, just re-pair from Jira — see Troubleshooting.
5 The Test Library
Alongside the per-issue panel, every project gets a Test Library — one full-page workspace where all your tests live, independent of any single issue. It's where you organise tests into folders, group them into plans, and watch every run in the project from a single monitor.
Open the project page
In Jira, open the project and find VibeTest by AppDash in the project's Apps area — under the More menu in the project sidebar. The page opens on the Library tab.
The issue panel (sections 6–8) shows the tests linked to one issue — handy while you're working that ticket. The project page shows every test in the project and adds plans and run-monitoring. A test you create on an issue appears in the Library automatically, and any Library test can be linked to an issue — so the two surfaces always stay in sync.
Six tabs, one page
Forge gives an app a single project page, so VibeTest packs everything into six tabs across the top:
| Tab | What it's for |
|---|---|
| Library | Your whole test inventory — browse, search, organise into folders, create, edit, and run tests. |
| Plans | Group Library tests into a named, ordered Test Plan and run them as a batch (section 9). |
| Run History | Every finished run in the project, newest first — individual runs and plan runs together (section 10). |
| Generation History | Every AI test-generation the project has run, and the tests each one produced. |
| Live | Runs, plans, and generations happening right now, updating as they go (section 10). |
| Reporting | Charts and tables over your run history — outcomes, trends, the tests that fail most, and coverage (section 11). |
The Library tab
The Library tab is a two-panel workspace: a folder tree on the left and a test grid on the right. The grid lists every test in the project — including tests linked to no issue at all, which never appear in an issue panel.
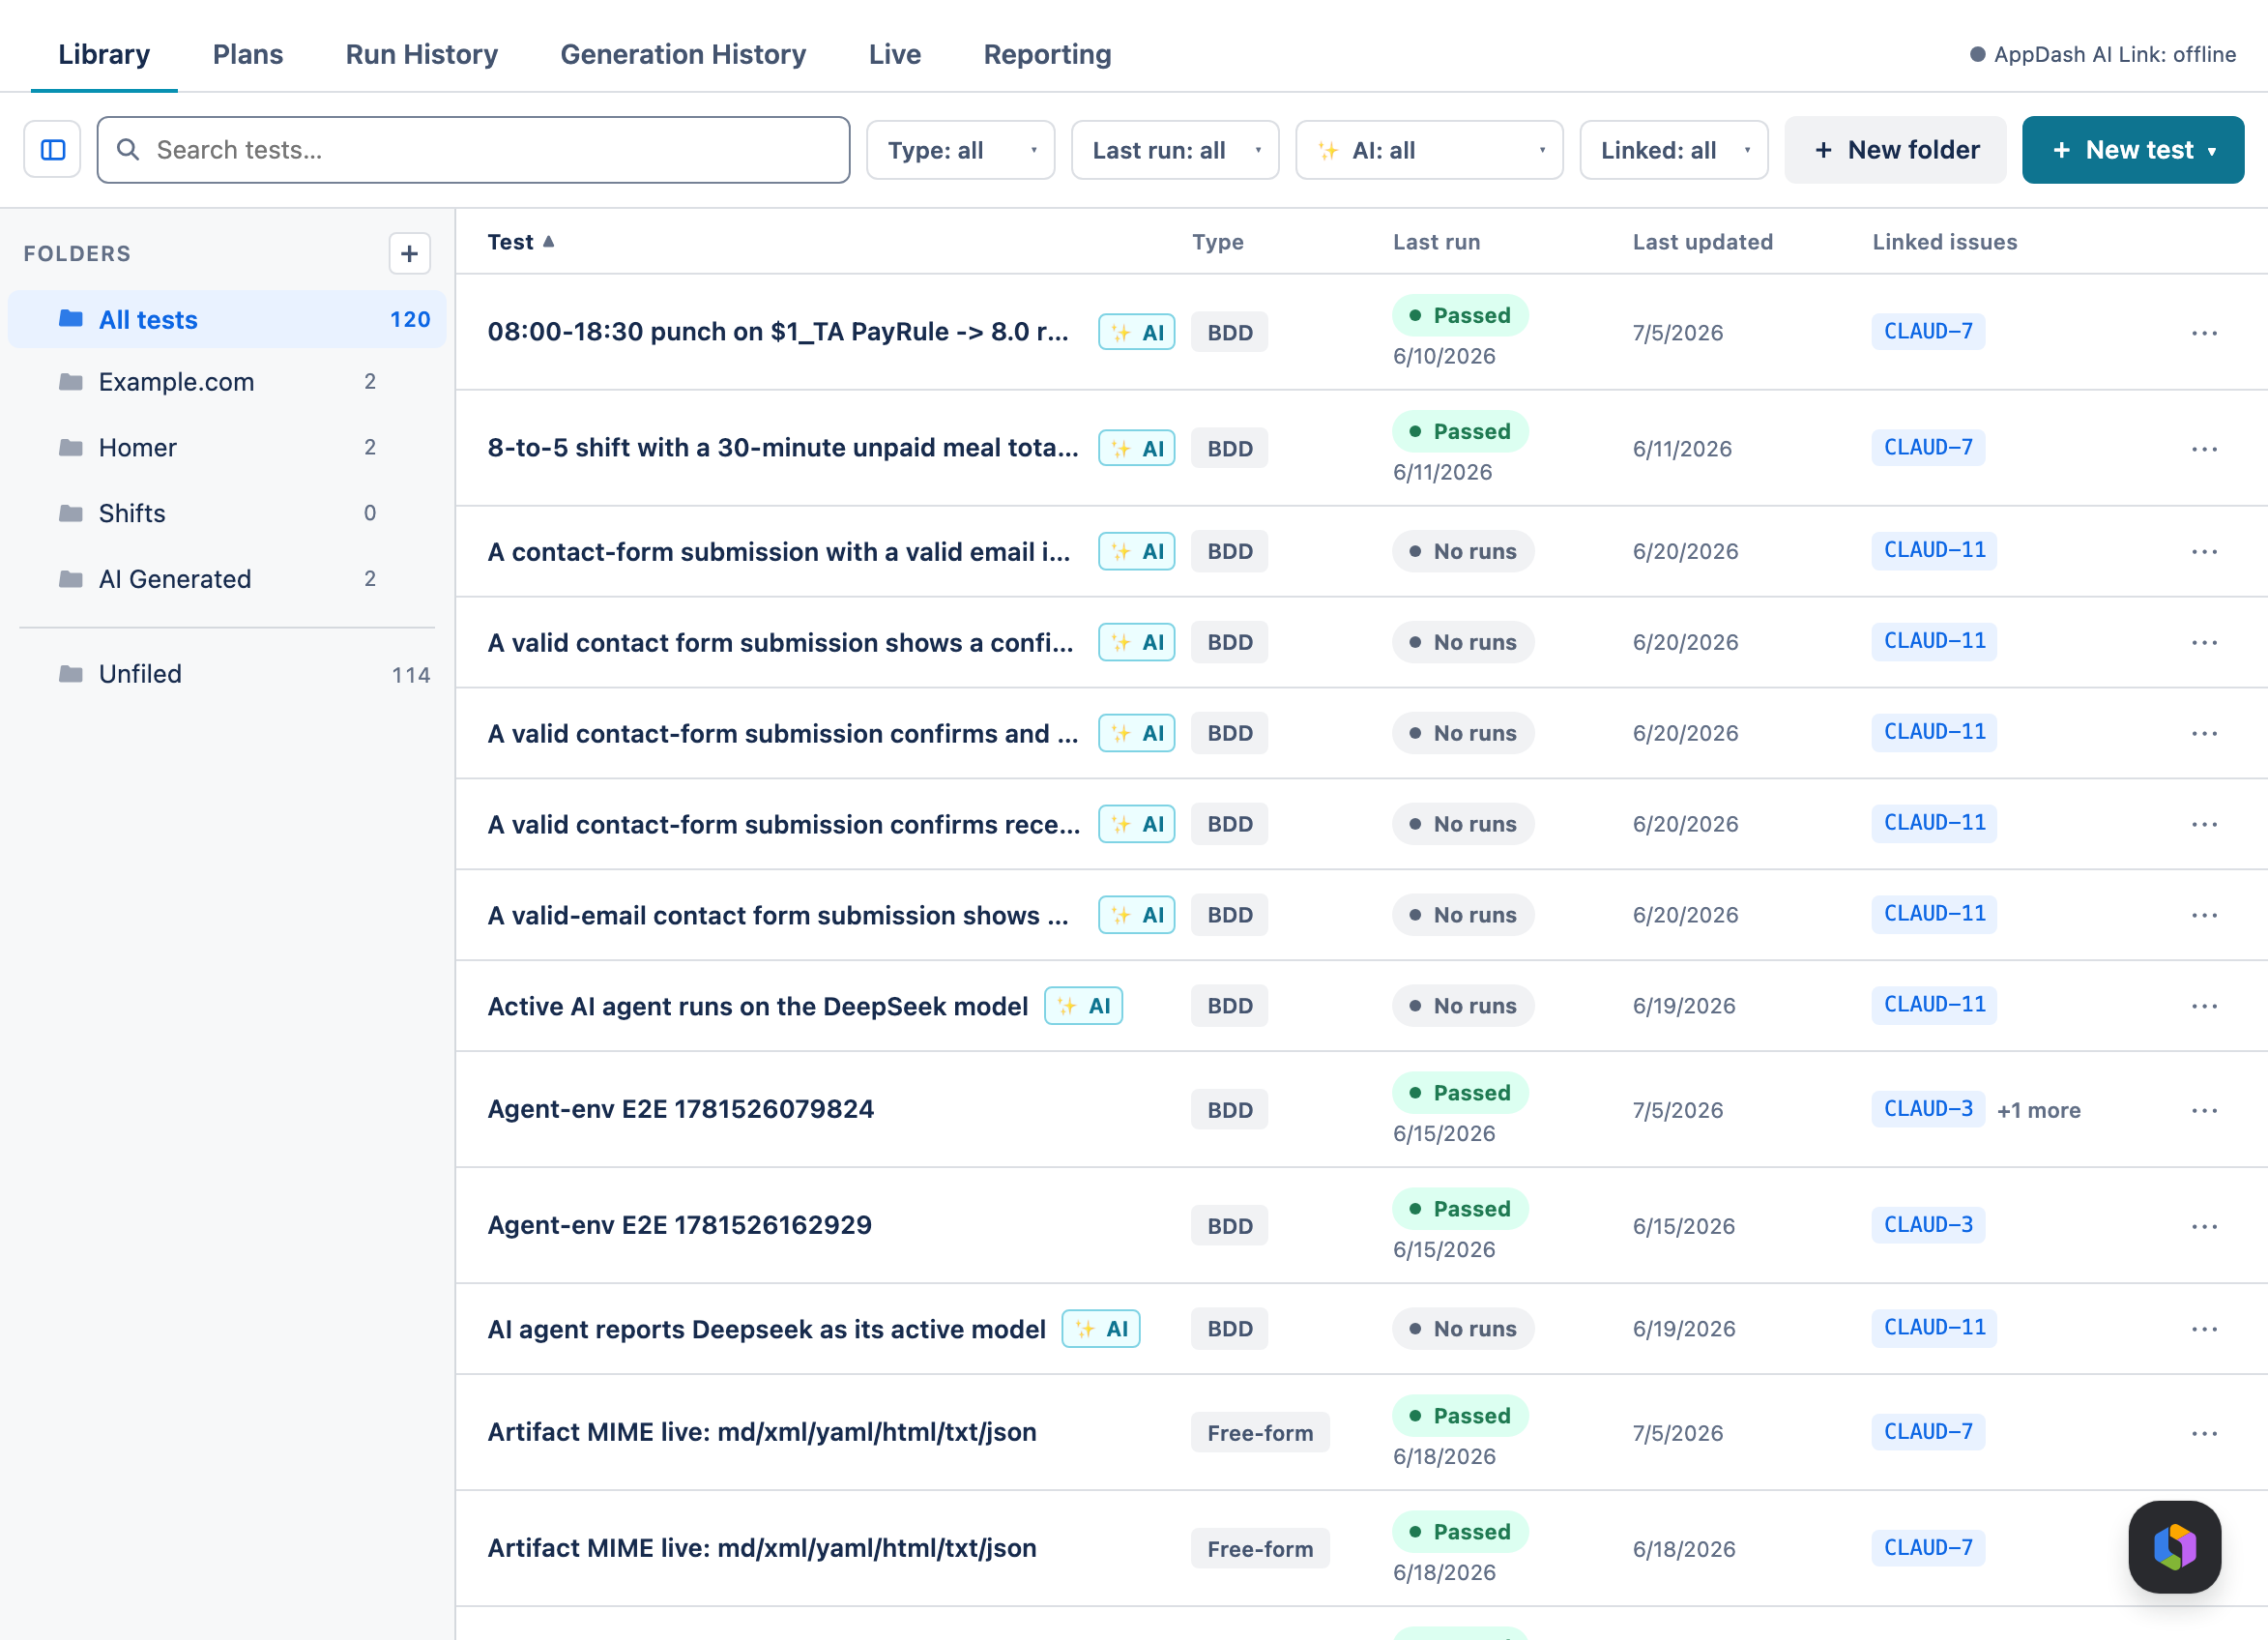
- Folder tree — click a folder to scope the grid to it. All tests shows everything; Unfiled shows tests not yet in a folder. Collapse the tree to give the grid the full width.
- Test grid — one row per test, with columns for Test (title, with its folder), Type, Last run, Last updated, and Linked issues.
- Sort any column — click a column header to sort by it; click again to reverse. An arrow marks the sorted column. Your choice sticks: the Library remembers it and restores it the next time you open the page, so you don't re-sort on every visit. (The preference is per-person and per-device — it doesn't change what your teammates see.)
- Jump to a linked issue — hover an issue key in the Linked issues column to see that issue's summary, and click it to open the issue in a new tab. Where a test is linked to several issues, the hover and click apply to the first key; the +N more alongside it is plain text.
- Search & filter — the toolbar has a Search tests… box plus filters for type, last-run status, and whether a test is linked to an issue. Filtering is instant, in your browser.
Organise with folders
Folders keep a growing library tidy. From the tree you can add a New folder, rename, delete, and nest folders inside one another; from a test's menu you can Move to folder. A test lives in exactly one folder (or none). Deleting a folder never deletes its tests — they simply return to Unfiled.
Create, generate, and edit — right here
Everything the issue panel can author, the Library can too — it's the same editor.
- New test — opens the BDD or Free-Form editor (section 6). Saving creates a project-owned test linked to no issue, filed in whatever folder you have selected, and ready to run.
- Generate with AI — drafts BDD tests from a description of what to cover. Generation runs on your paired computer, and the drafts land in your Library — AI-badged and unlinked — for you to review and save.
- Edit — opens a test in the same editor. If it's linked to several issues, a banner reminds you that edits apply to all of them — there's one shared definition, not a copy per issue.
On a brand-new project the Library shows an empty state — "Your test library is empty" — with buttons to create or generate your first test.
The test drawer
Click a test row to slide open its drawer — the full test, without leaving the grid. It shows the test's definition and its run history, and gathers every per-test action in one place:
| Action | What it does |
|---|---|
| Run | Runs the test on your paired computer. Linked to one issue → the result posts there; linked to none → it runs issue-less; linked to several → you're asked which issue. |
| Link to issue / Unlink | Attach the test to a Jira issue (search by key or summary) or detach it. A test can be linked to many issues; unlinking the last one is fine — the test stays in the Library. |
| Move to folder | File the test under a different folder. |
| Duplicate | Make an unlinked copy in the same folder — handy for a variation. |
| Edit / Delete | Change the test's steps or title, or remove it permanently (along with its run history). |
| Record a result | Log a manual pass/fail — exactly as on the issue panel (section 12). |
A test belongs to the project, not to a single issue. Link it to the issues it verifies (one or many), or leave it unlinked and run it straight from the Library. Editing the test updates it everywhere it's linked — so a shared regression check stays in one place instead of drifting into copies.
6 Write a test
However you start a test — from an issue's VibeTest panel or from the Library — you write it in the same editor. This section walks through that editor. The only difference between the two starting points is whether the test begins linked to an issue.
Open the VibeTest panel on an issue
Once your Jira admin has installed the app, each issue gains a Tests section — that's the VibeTest panel. Open any Jira issue and scroll down, past the description and fields, to find it.
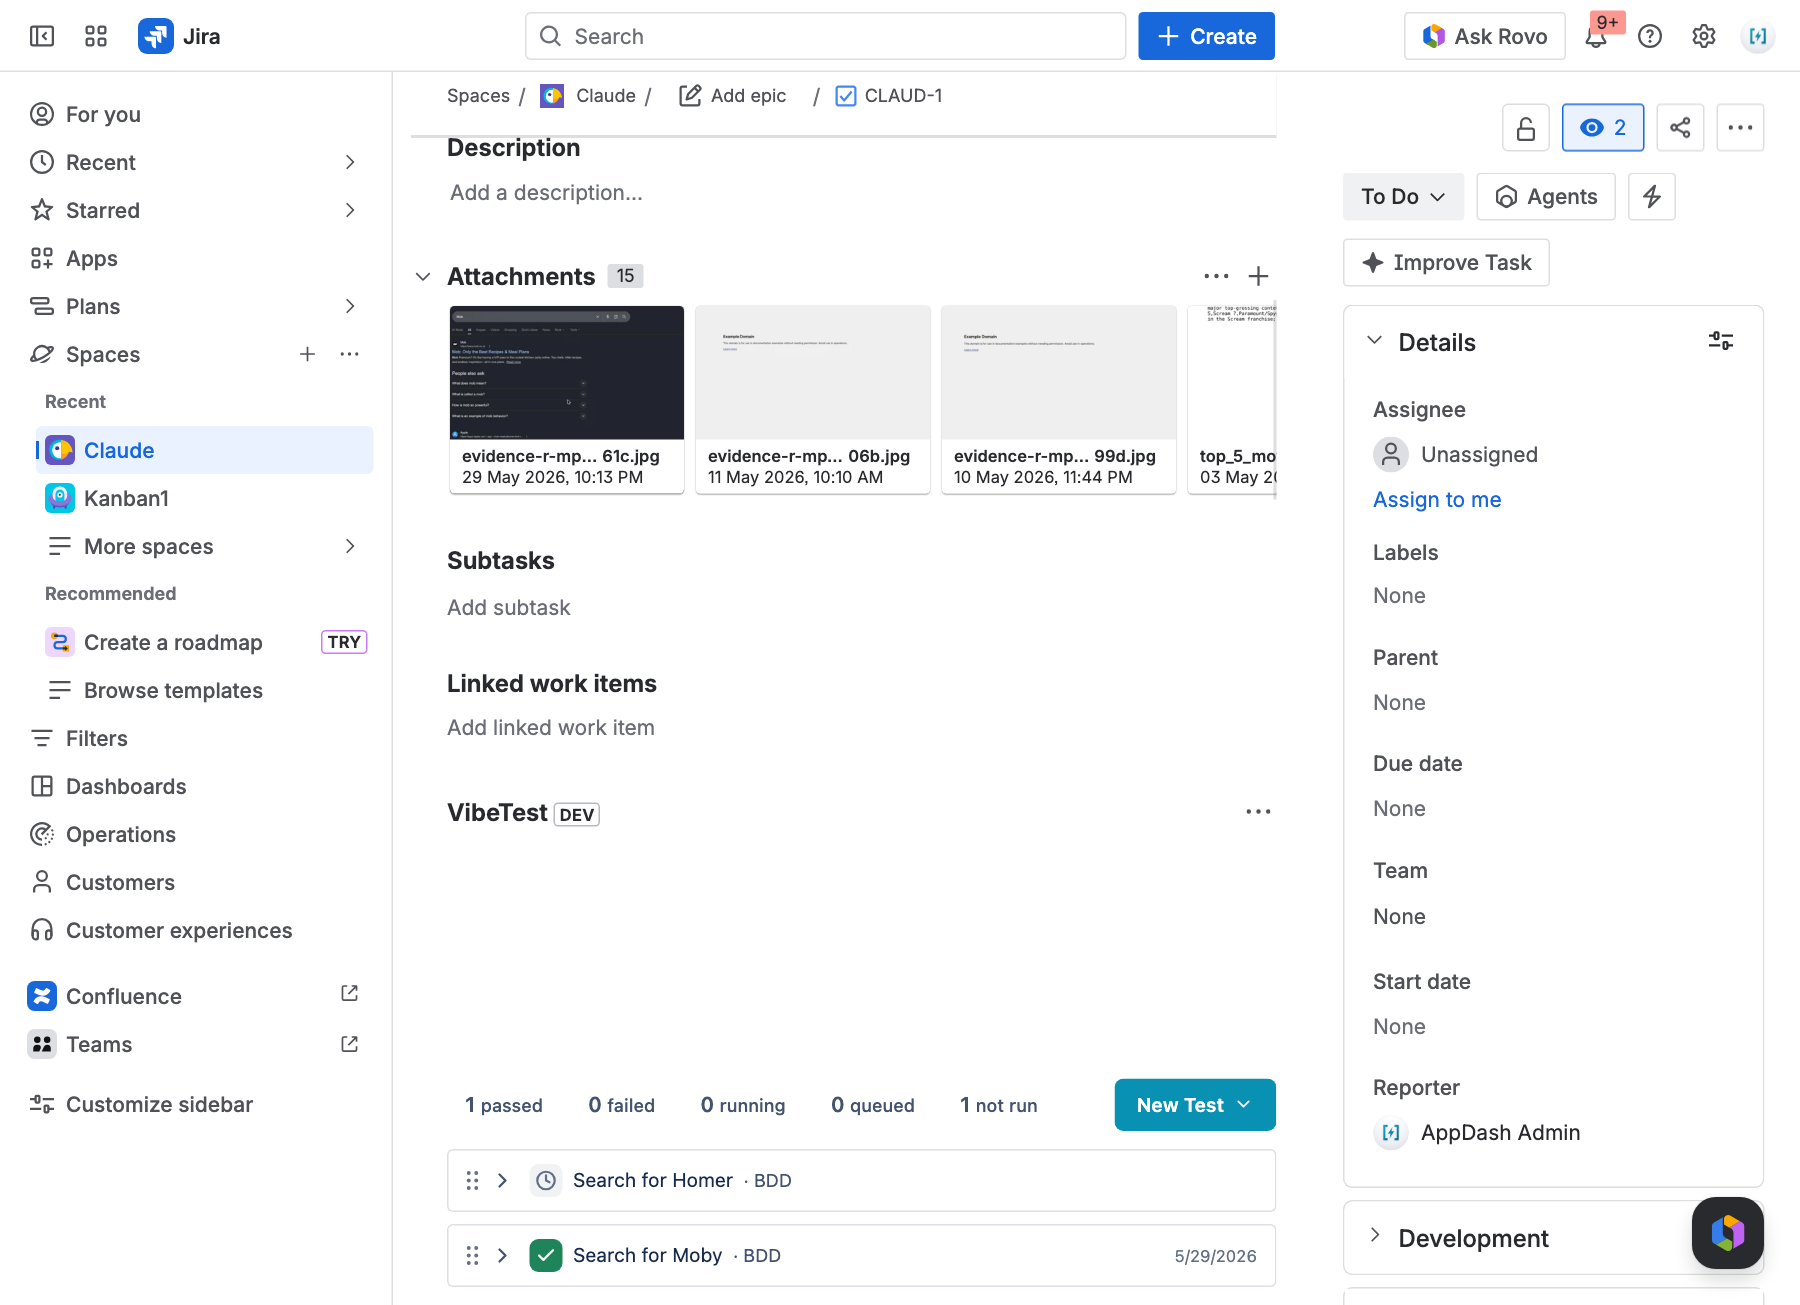
On an issue with no tests yet, the panel shows a welcome screen inviting you to create your first one.
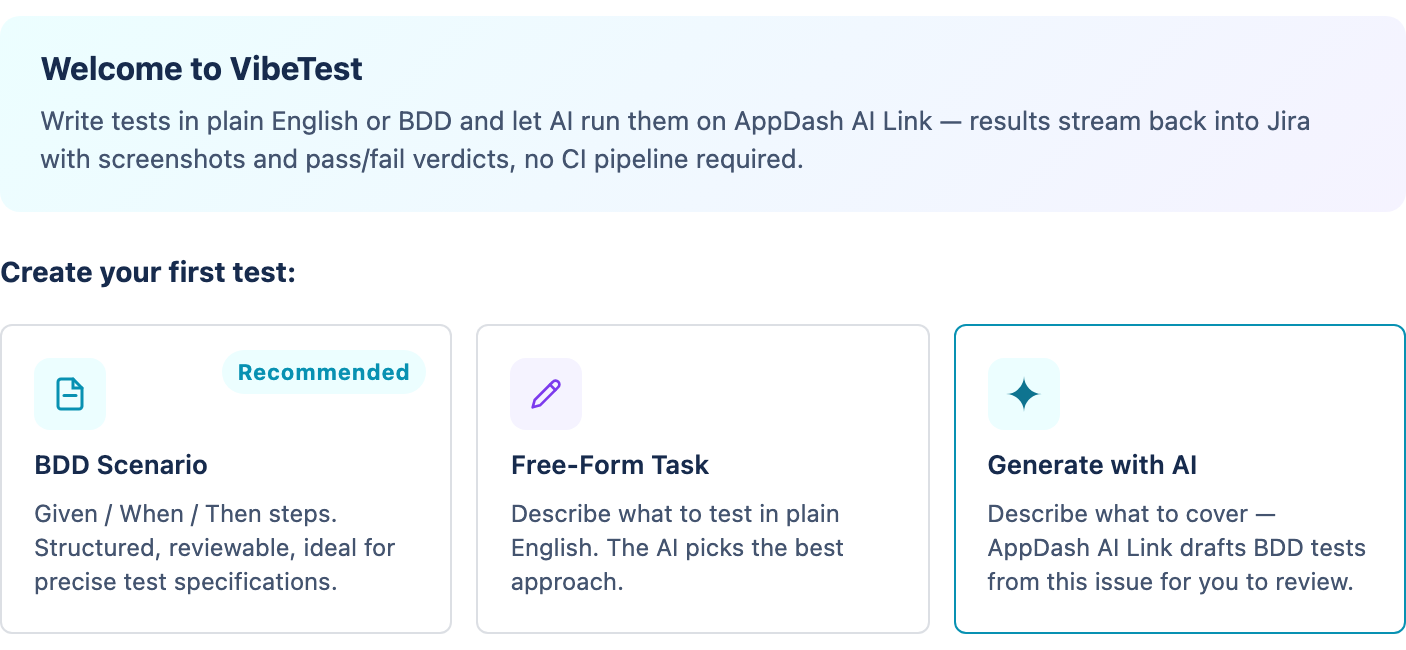
Three ways to write a test
| Type | Best for | How you write it |
|---|---|---|
| BDD Scenario Recommended | Precise, reviewable tests with clear steps. | Structured Given / When / Then steps. Each step is checked individually, so results show exactly which step failed. |
| Free-Form Task | Quick checks where you'd rather just describe the goal. | A plain-English description of what to test and what success looks like. The AI decides how to carry it out. |
| Generate with AI | Drafting tests fast from a description of the issue. | Describe what to cover; your paired computer running AppDash AI Link drafts BDD tests from this issue for you to review and edit. |
Writing a BDD scenario
Click BDD Scenario. The editor opens with your test as a list of steps — each a coloured keyword plus a plain-English sentence. The title you gave the test becomes the scenario name.
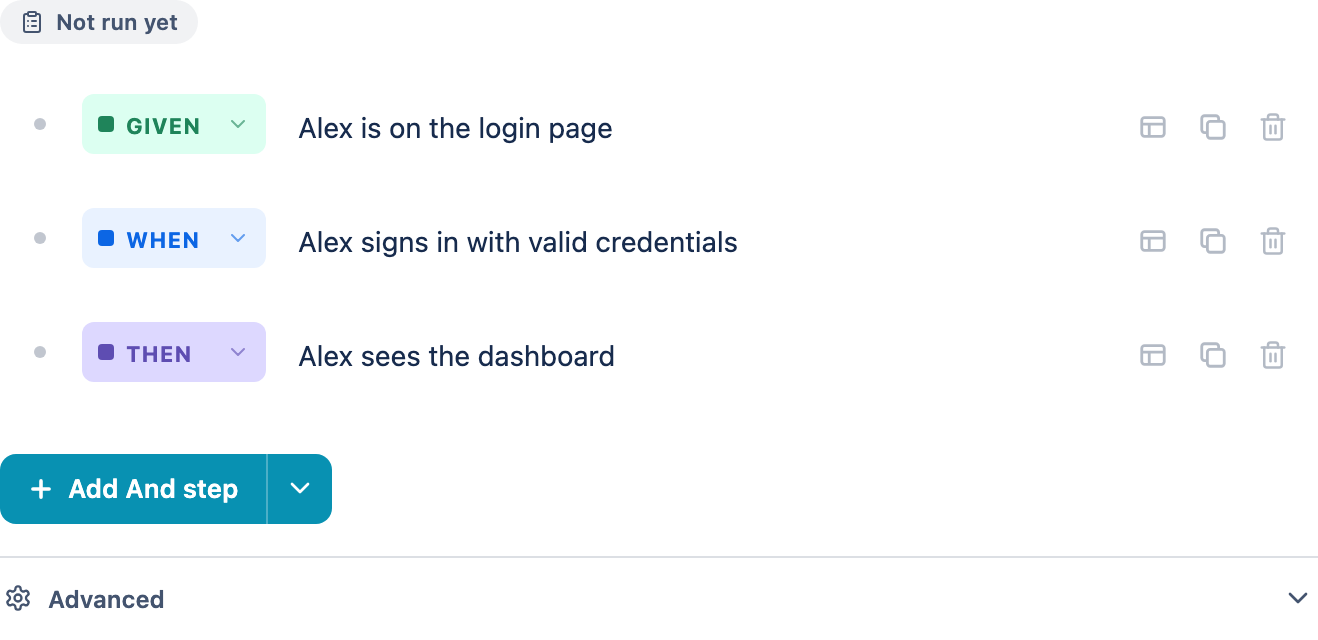
Anatomy of a step
Reading a step row from left to right:
- A status dot shows that step's result after a run, and a grip handle beside it lets you drag the step to reorder it (or focus it and use the arrow keys).
- The keyword — a coloured dropdown (Given / When / Then / And / But). Click it to change the keyword.
- The sentence — a plain-English text box describing the step; it grows as you type.
- Row actions on the right — add a data table, duplicate the step, or delete it.
Given, When, Then — what each step means
BDD describes behaviour as a short story: set the scene, take an action, then check the result. Each keyword has a job (and a colour), and every step is checked individually — so a run shows exactly which one failed.
| Keyword | What it's for | Example |
|---|---|---|
| Given | The starting context — set the scene before anything happens. | Given Alex is on the login page |
| When | The action under test — the one thing you're exercising. | When Alex signs in with valid credentials |
| Then | The expected outcome — what must be true for the test to pass. | Then Alex sees the dashboard |
| And / But | Continue the previous step. And adds another of the same kind; But adds a contrast or negation. | And the banner shows their name · But no error appears |
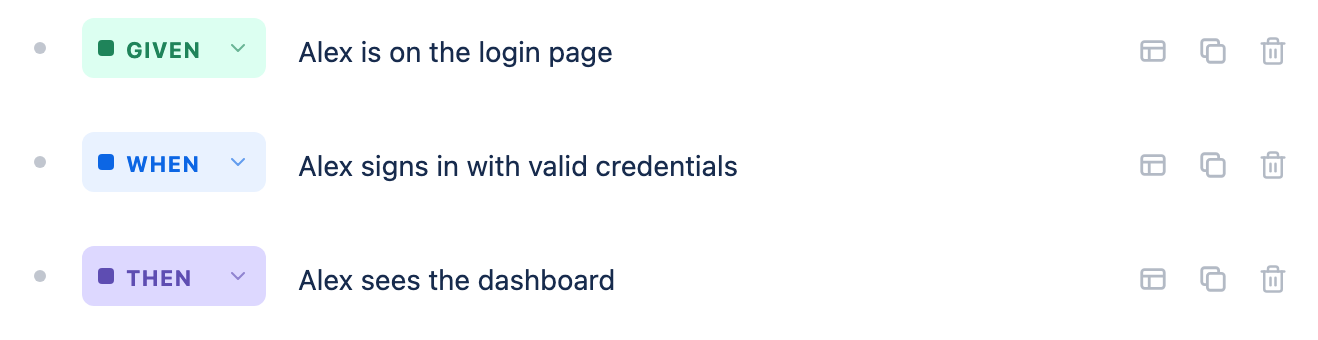
One idea per step. A focused Given → When → Then reads clearly, and when it fails the result points at a single sentence rather than a paragraph.
Adding steps
The blue + Add … step button adds the next step and suggests the natural keyword — after a Given it offers When, then Then, then And. To add a specific keyword instead, click the ▾ caret on the right of the button and pick one.
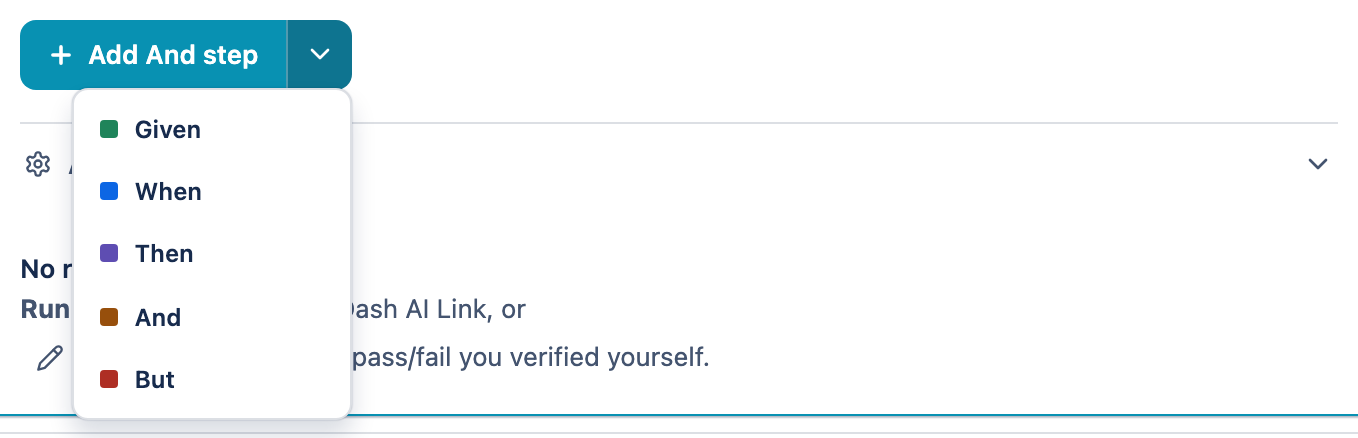
Press Enter at the end of a sentence to add the next step without reaching for the mouse; Shift+Enter inserts a line break within a step. Use the duplicate icon to copy a similar step, and the trash icon to remove one.
Reordering steps
Steps run top to bottom, so order matters. To move one, hover the step to reveal its drag handle (the grip on the left), then drag it up or down — a teal line shows where it will land. Prefer the keyboard? Tab to the handle and press ↑ / ↓.
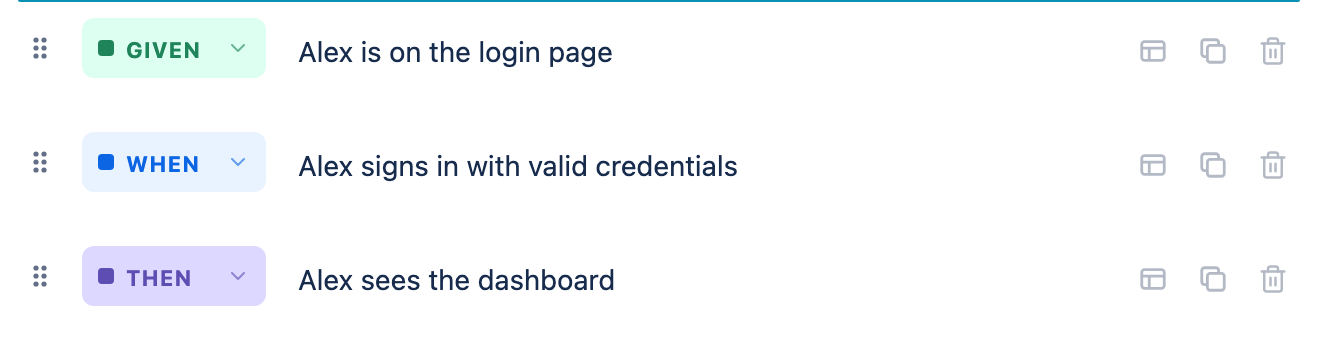
Adding a data table to a step
A data table attaches a small grid of structured data to a step — handy for example inputs such as credentials, products, or parameters. Click the table icon in a step's row actions to add one.
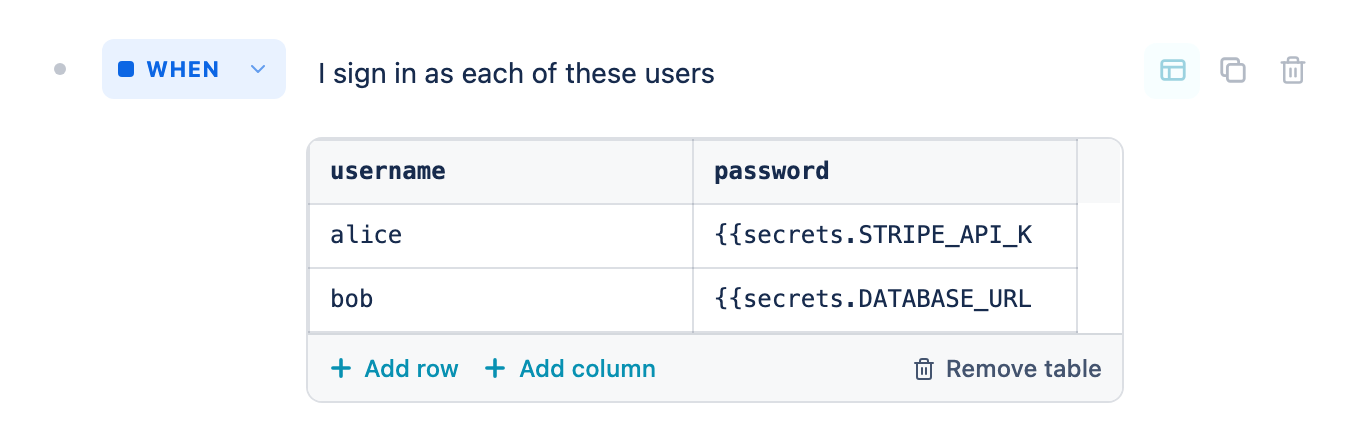
{{secrets.STD_PW}}.- Edit any header or cell by clicking it.
- + Add row / + Add column grow the table; hover a row or column and click its ✕ to remove it.
- Remove table detaches the table from the step.
Save it
Click Save in the top bar. A "Saved" confirmation flashes and the test joins the list on the issue. Your edits are held locally until you save, so you won't clash with someone editing the same test at the same time.
Open Advanced (below the steps) to Import Gherkin by pasting a scenario to replace the steps, or preview the exact prompt sent to the agent. To keep a password out of the saved test, reference a stored secret with {{secrets.NAME}} in any step or table cell — see Use secrets in your tests.
Prefer free-form? Click Free-Form Task instead and describe the test in two boxes: the Task (what to do) and the optional Success criteria (how to tell it passed).
Generate tests with AI
Click Generate with AI (or choose it from the New Test menu) to let the AI draft BDD tests for you. Describe what to cover in the Requirements box and click Generate. Generation runs on your paired computer — your local agent produces the drafts — so pair the free AppDash AI Link app first. The drafts arrive AI-badged for you to review, edit, and save.
Two controls shape what you get back (both appear once a computer is paired):
- Number of tests — ask for 1 to 5 tests in a single generation.
- Design techniques (optional) — steer the mix by picking any of Happy path, Boundary values, and Negative / error paths. Choose none and the generator aims for a spread across all three.
A generation is allowed to take its time — the agent can read your codebase and call its tools to write better tests, so it isn't capped the way a test run is. Expect a generation to take longer than a run; it appears on the Live tab while it works, and lands in Generation History when it's done.
7 Manage your tests
Once an issue has tests linked to it, the panel shows them as a list. The top of the panel gives you an at-a-glance summary and a button to add more. (To see and organise every test in the project, use the Test Library.)
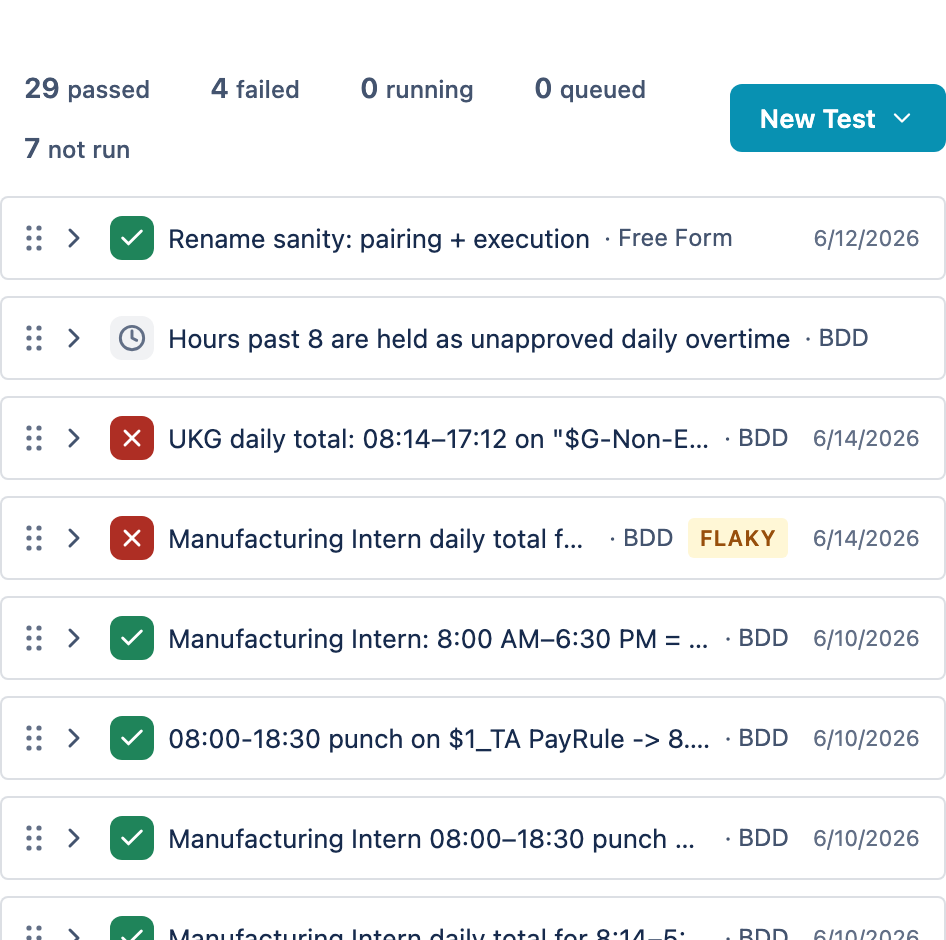
Reading the list
- Status tiles count tests by their latest run. Click a tile (e.g. failed) to filter the list to just those tests; a banner appears with a Clear filter link.
- Each row shows a status icon, the title, the type (
BDDorFree Form), a status pill (passed failed running queued), and the time of the last run. A failed test also shows a one-line summary of what went wrong. - A FLAKY chip appears when a test has been giving mixed results across its recent runs.
- Tests stay in the order you arrange them. Drag a row by its grip to reorder it (or focus a row and press ↑/↓); the order is saved. Reordering is available when no status filter is active.
Adding more tests
Click New Test (top-right) and pick BDD test, Free-Form test, or Generate with AI — the same flows from section 6 — or Add from Library to link an existing Library test to this issue instead of writing a new one. A test can be linked to several issues at once; linking never copies it.
Opening and editing a test
Click any row to expand it. The row and its editor fuse into a single teal-outlined focus card so the test you're working on stands out from the rest of the list.
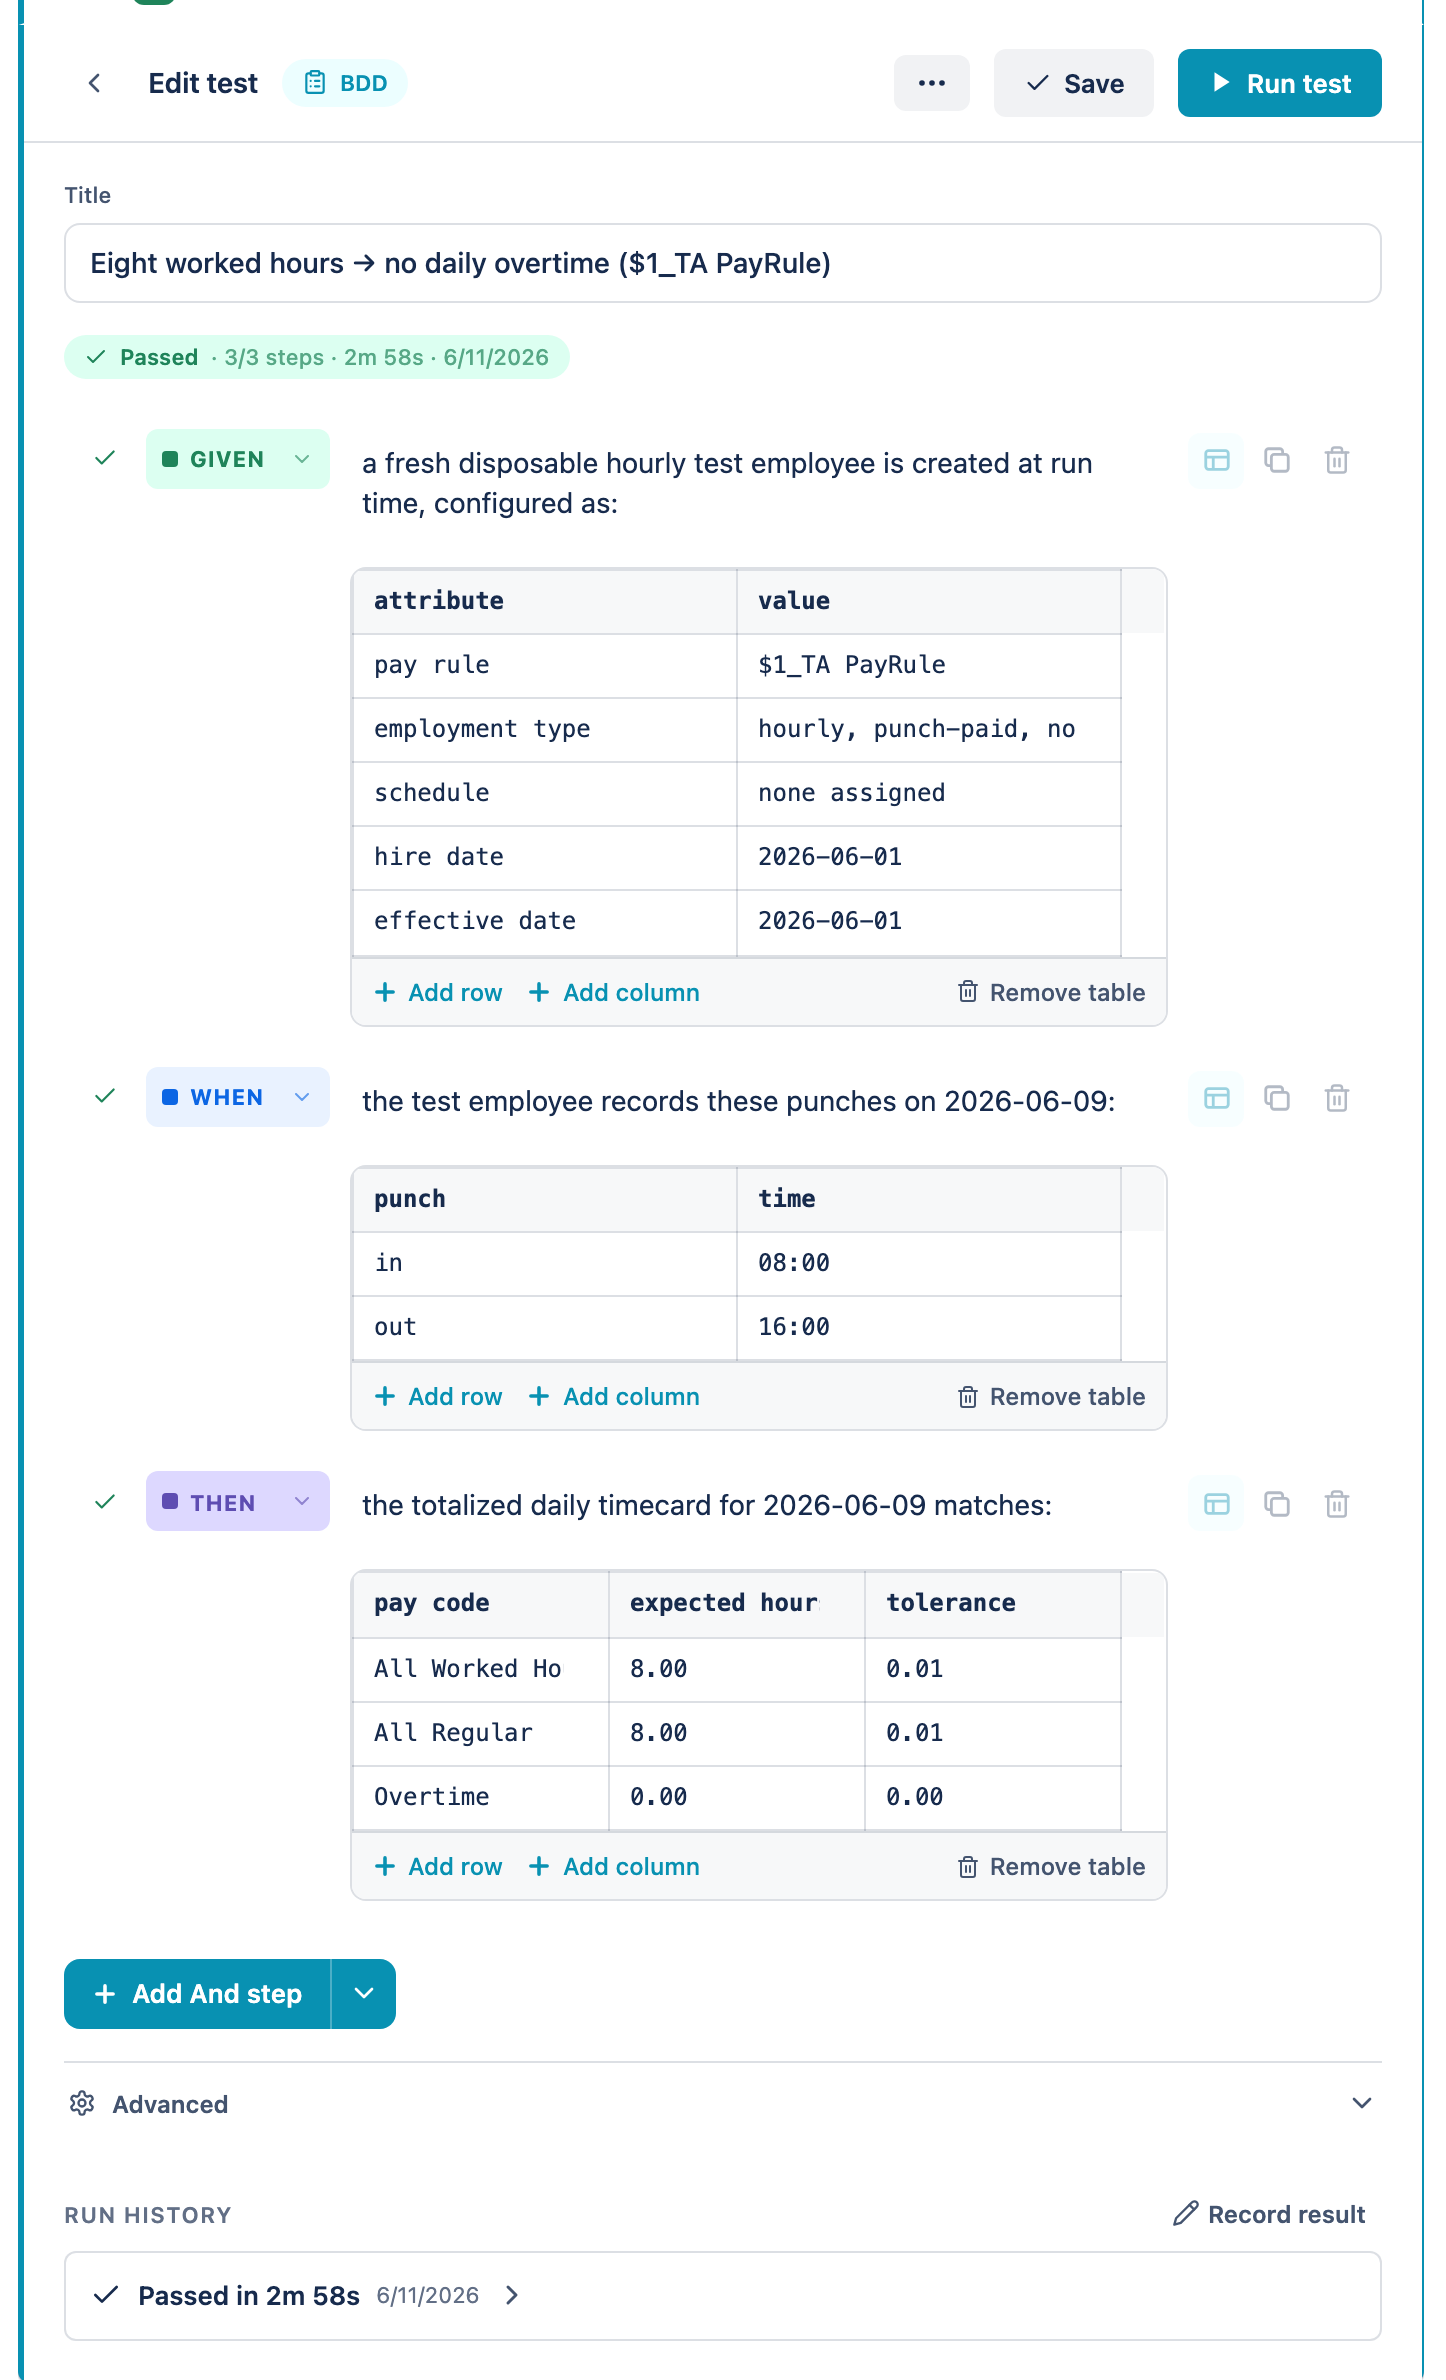
- Edit the title or any step, then click Save. A "Saved" flash confirms it. Your edits are kept locally until you save, so you won't lose work if someone else changes the test at the same time.
- Duplicate (in the ⋯ menu) makes an identical copy to tweak — handy for testing variations.
- Remove or delete (in the ⋯ menu) — for a test linked only to this issue, Delete removes it and its run history for good. For a test linked to several issues, you instead Remove from this issue: the link is dropped but the test stays in the Library and on its other issues. Either way, you confirm first.
8 Run a test
Running a test sends it to your paired computer, where the AI agent carries it out for real. You start it from wherever the test is — the issue panel's focus card, or the Library drawer and grid.
- Open the test by clicking its row to expand the focus card.
- Click ▶ Run test in the editor's top bar. (Run test appears on any saved test — BDD or Free-Form; it's disabled only while a run is already in progress.)
- Confirm in the dialog. A short "Run this test with your AI agent?" panel names the device the run will go to; click Run test to dispatch (or Cancel to back out).
- Watch it go. A run card appears and moves through these states:
- Queued — sent to your computer, waiting for it to pick up.
- Running — the agent is executing. For BDD tests the step checklist lights up step by step in real time, with a spinner on the current step.
- Passed / Failed — the final verdict (covered next).
A test can only run if your computer is paired (section 4) and the desktop app is open and polling. If you click Run test with no paired computer, VibeTest stops you with a "No AI Link connection to run this test" dialog asking you to pair first — nothing is sent until a computer is connected.
If a run runs unusually long, a Stop Run button appears on the run card (a few seconds after it starts running). Click it to cancel; the run is marked Cancelled. Each run also has a built-in timeout that auto-stops a run that runs too long.
Running from the Library — with or without an issue
You can also launch a run straight from the Library grid or a test's drawer. What happens depends on how the test is linked:
- Linked to one issue — the run posts its result back to that issue, exactly as an issue-panel run does.
- Linked to several issues — VibeTest asks "Run on which issue?" so the result lands on the one you mean.
- Linked to no issue — the test runs issue-less (project-scoped): nothing is posted to Jira, and the result appears in the test's own run log in the Library and in Run History.
Running a test with no linked issue is a newer capability, so it needs a reasonably recent AppDash AI Link. If your computer is running an older build, the run comes back asking you to update the app first (see Troubleshooting). Runs tied to an issue work on any paired version.
Want to run several tests in one go? Group them into a Test Plan and run the whole plan at once.
9 Test Plans
A Test Plan is a named, ordered group of Library tests you run as a batch — a regression suite, a smoke set, a release checklist. Plans live on the Plans tab of the project page.
Build a plan
- Create it. On the Plans tab, click + New plan and give it a name. It appears in the plan list on the left.
- Add tests. With the plan selected, click Add tests and pick from your Library (browse by folder or search). The tests you choose become the plan's members.
- Put them in order. Plans run top to bottom, so order matters. Drag a member by its grip — or focus it and press ↑/↓ — to reorder, and remove one with its ✕.
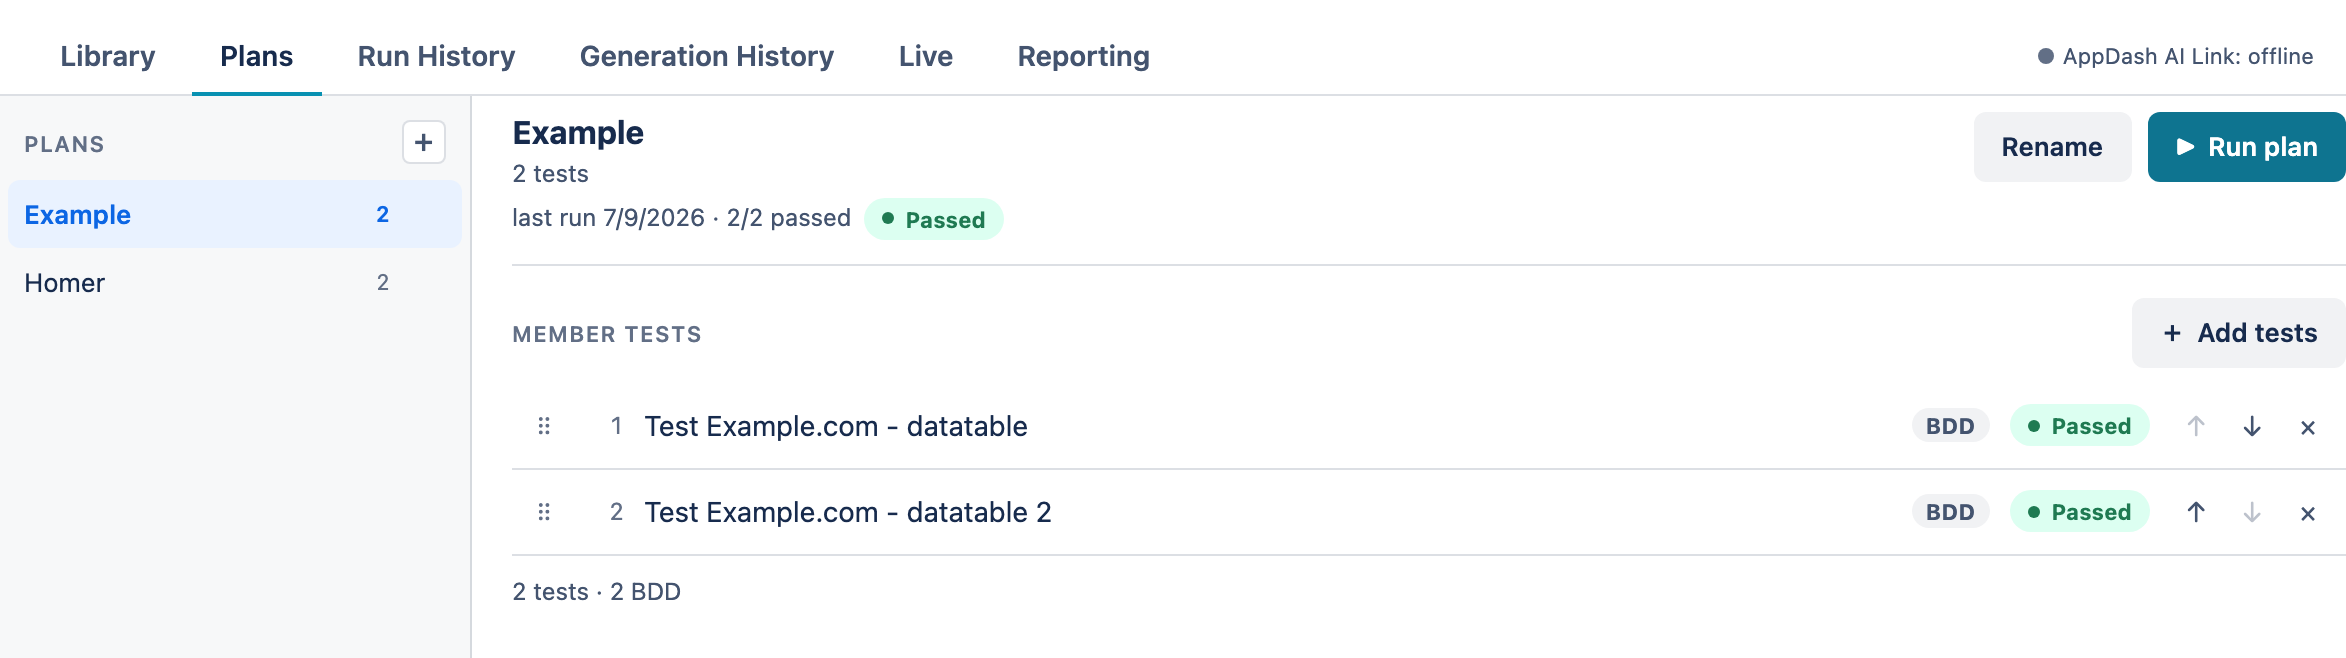
A plan holds references to tests, not copies — so editing a test updates it wherever it's used, and the plan's footer keeps a running tally (e.g. "6 tests · 4 BDD · 2 free-form"). Rename or delete a plan from its ⋯ menu in the list.
Run a plan
Click ▶ Run plan in the plan's header. VibeTest checks your desktop is reachable, then runs each member one at a time, in order, on your paired computer. The page switches to the Live tab so you can watch progress member by member.
- Every member runs issue-less — the plan's results live in the project, not on any single issue.
- One plan per project at a time. Start a second plan while one is running and it queues behind the first, then begins automatically when the first finishes.
- Stop a running plan to cancel the current member and skip the rest; the plan is marked cancelled, and any queued plan takes over.
Read the results
When a plan finishes it produces a report — a pass/fail roll-up across its members (e.g. "6 / 8 passed") with each member's verdict. Finished plan runs appear in Run History alongside individual runs; expand one to open its report. Each plan's header also shows a quick last-run health line ("last run 2h ago · 6/8 passed").
Need to run it again? A finished plan report offers Re-run all or Re-run failed only — the latter repeats just the members that didn't pass, taken from that run's snapshot.
10 Monitor runs: Live & History
The project page keeps a running record of everything across the project — what's in flight now, and everything that has finished. Three tabs cover it: Live, Run History, and Generation History.
Live — what's happening now
The Live tab lists every run, plan, and AI generation in flight right now, grouped into Running and Queued. It refreshes itself every few seconds: items appear, light up step by step, and drop into history when they finish. A plan that completes while you watch lingers briefly under Recently finished with its report.
- A desktop status chip in the top-right shows whether a computer is online to take work — it uses the same check the run dispatcher does, so it can't claim "online" when a run would actually be refused.
- A queued item explains why it's waiting — the desktop is offline, paused, or busy on another project's plan — so a run that doesn't start right away never leaves you guessing.
Run History — everything that finished
The Run History tab is the project-wide record of finished runs, newest first — individual runs and plan runs interleaved. Each row shows the test (or plan), its verdict, and when it ran; click a row to expand it in place — an individual run opens its full result card, a plan run opens its report.
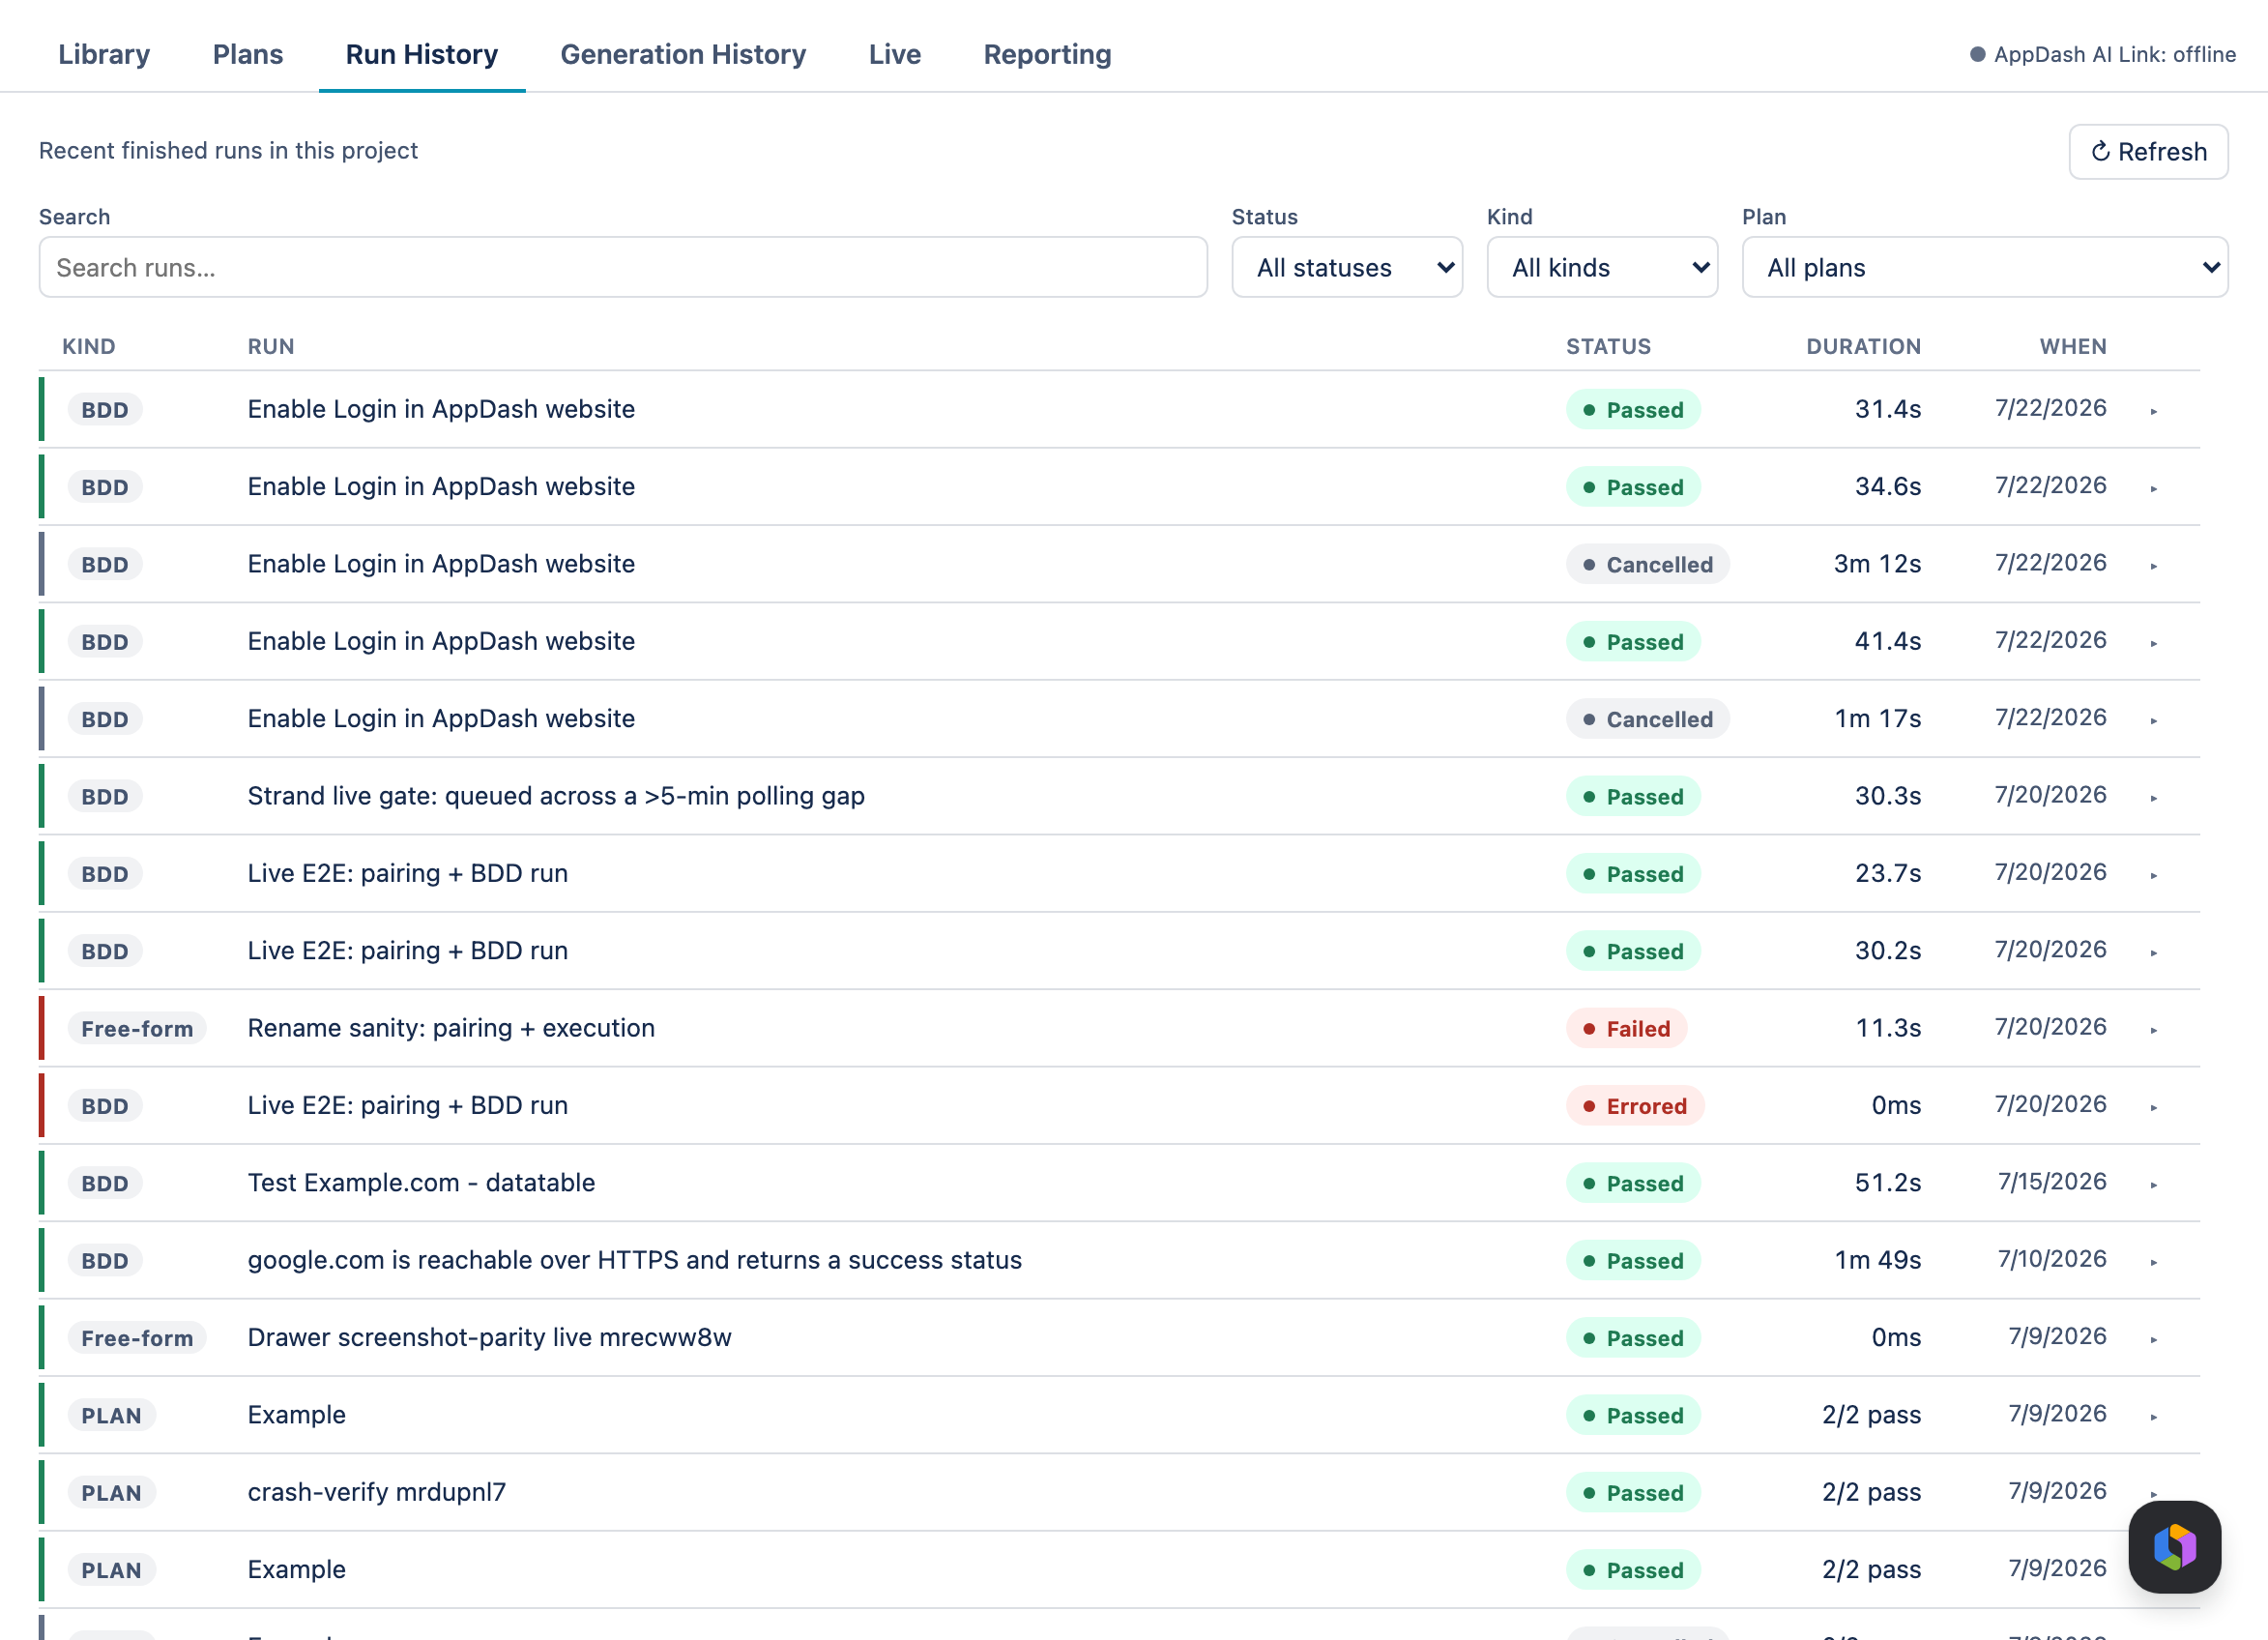
- Search and filter the list by status, kind, or text — instantly, in your browser.
- Load more pages further back through the history.
- ↻ Refresh re-pulls the latest; Delete result (behind a confirm) removes a run you don't want kept — it's gone from the monitor and from that test's history. Only the person who started a run can delete it.
Generation History — AI drafts
The Generation History tab lists every Generate with AI the project has run. Expand a row to see the tests that generation produced, and click one to open it in the test drawer. Like Run History, it's searchable and filterable.
These three tabs answer "what happened?" one run at a time. For the view across all of them — pass rates, trends, and the tests that fail most — see Reporting.
11 Reporting
The Reporting tab turns your run history into charts and rankings — what's passing, what keeps breaking, and where your coverage is thin. It reads the runs you've already done, so there's nothing to set up: run some tests and the reports fill in.
Open the project page and choose the Reporting tab (the sixth). On a project with no runs yet it simply says "No runs yet" — run a test or a plan and come back.
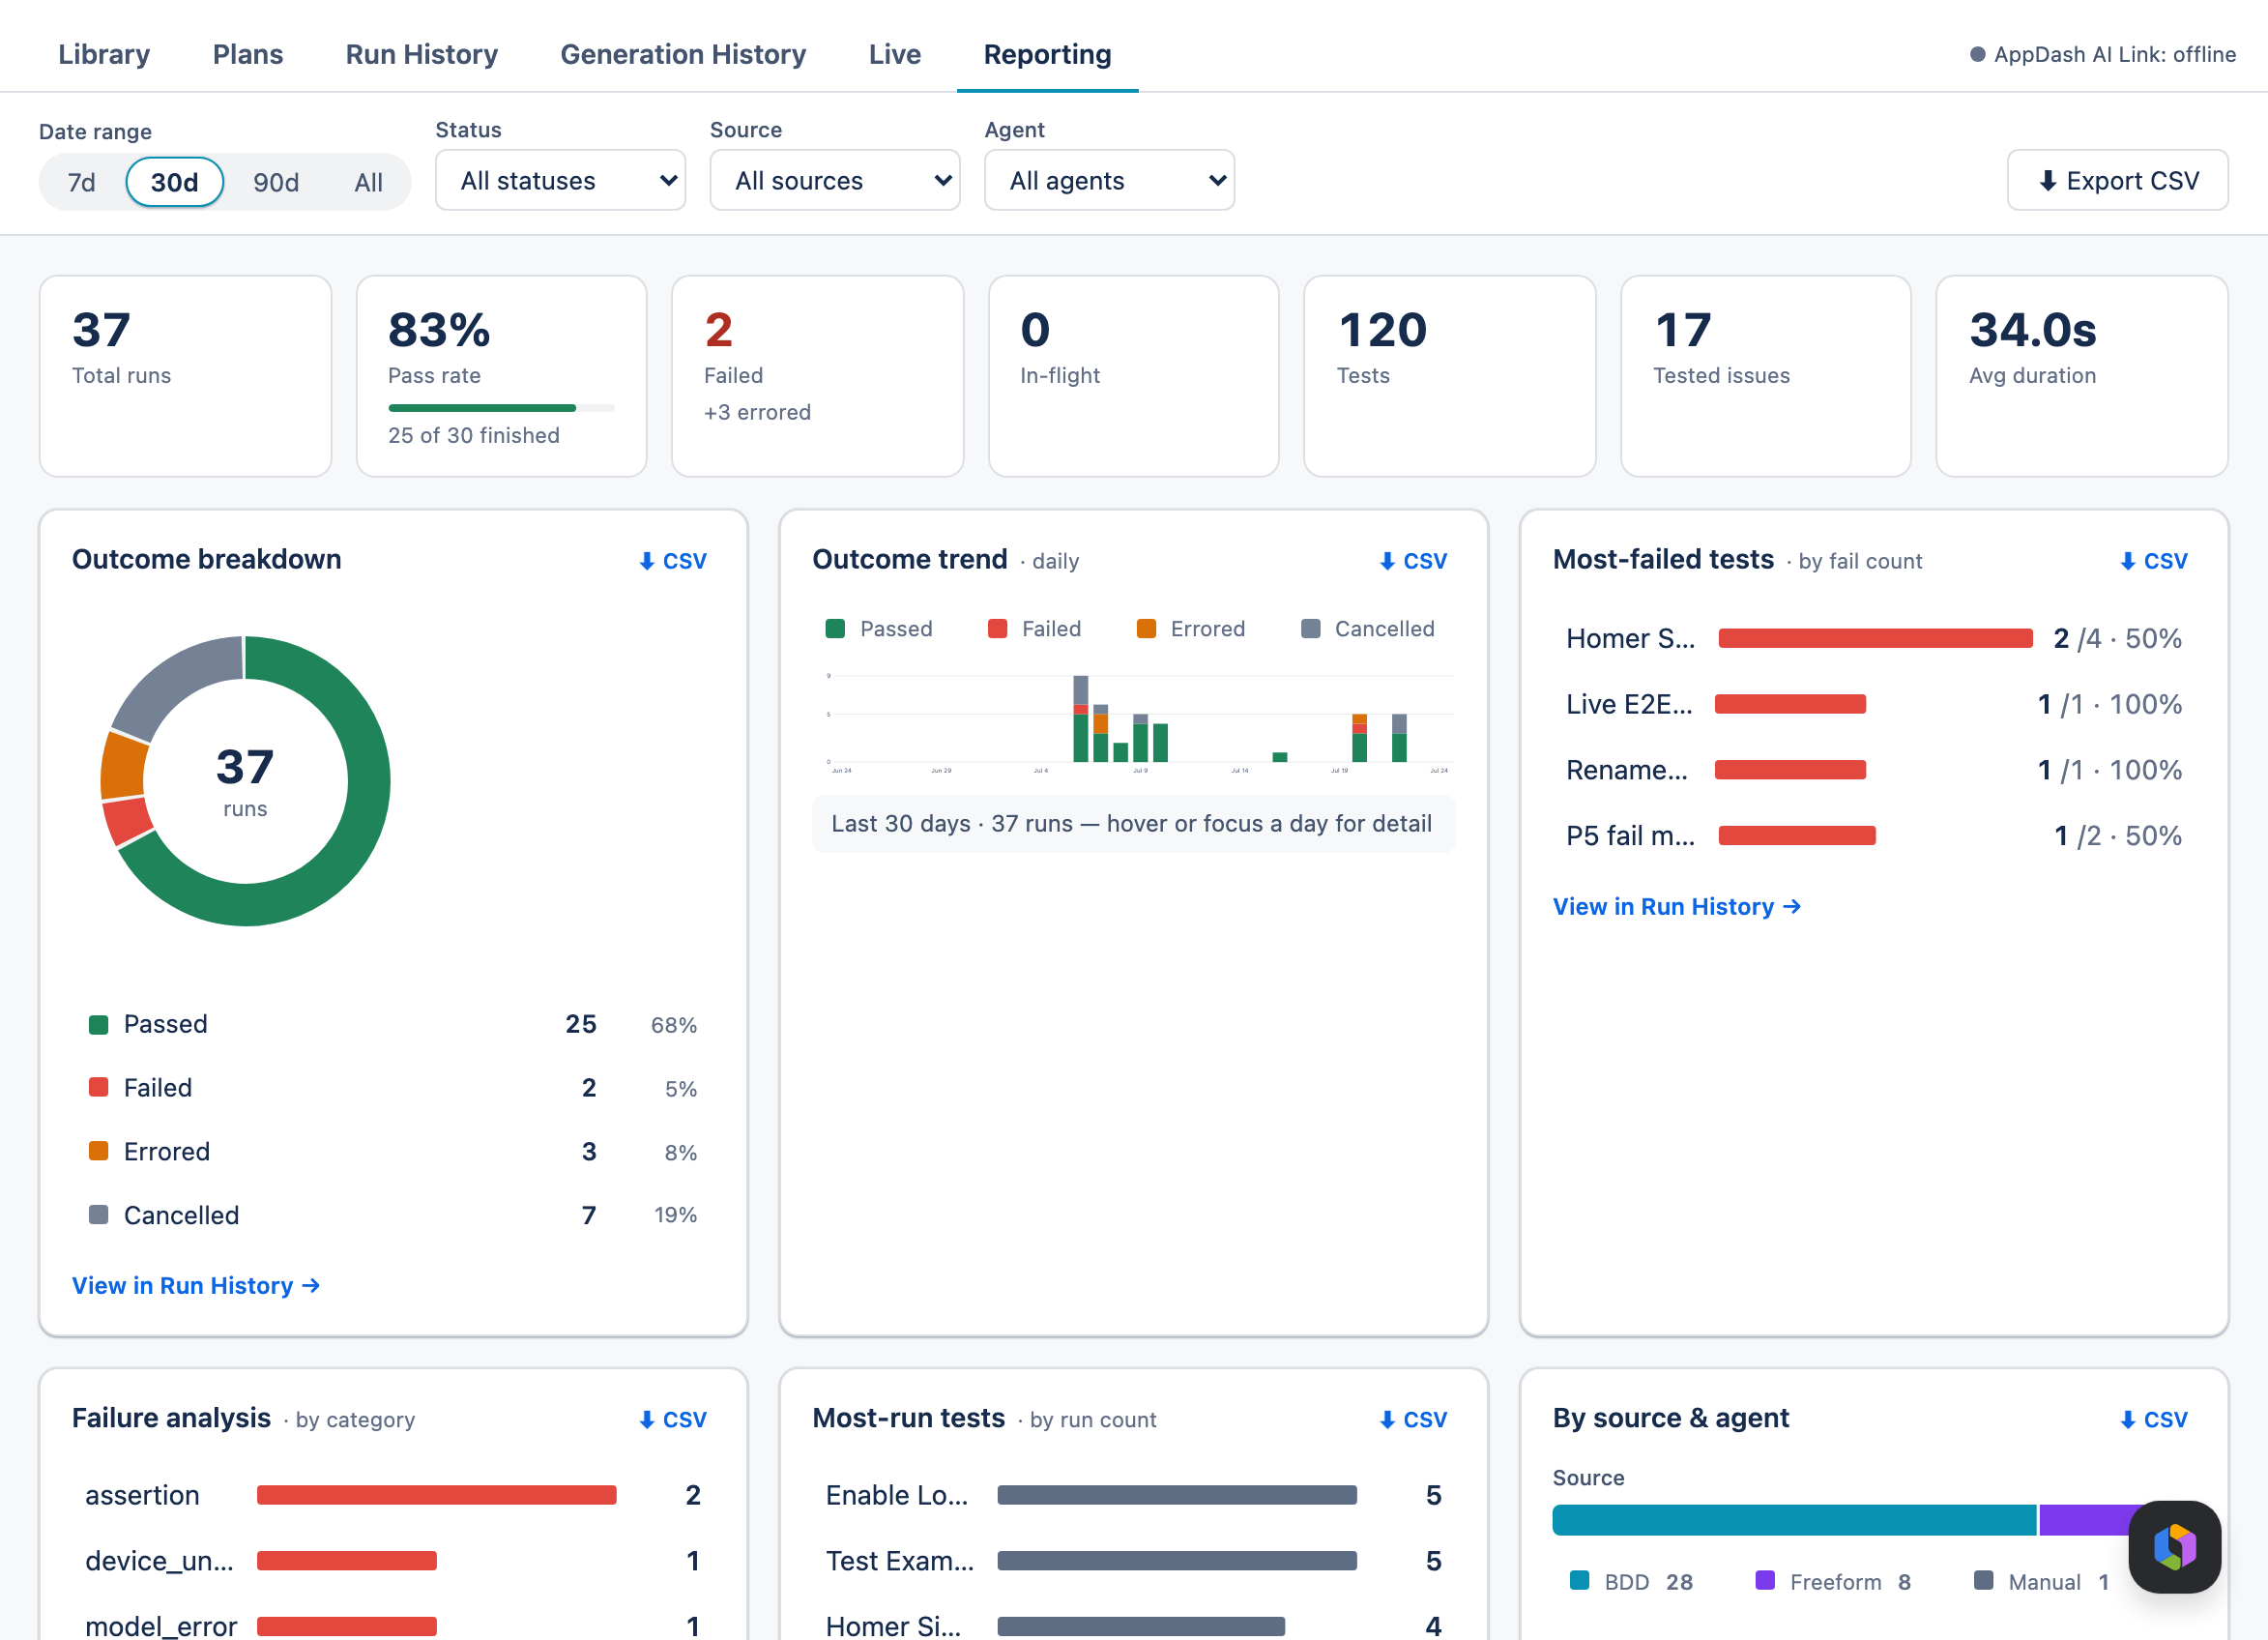
The numbers at the top
A strip of seven tiles summarises the period you've selected:
| Tile | What it counts |
|---|---|
| Total runs | Every run in the period, of every kind. |
| Pass rate | The share that passed, with a meter and the underlying count ("25 of 30 finished"). |
| Failed | How many came back failed — with errored runs called out separately beneath ("+3 errored"). |
| In-flight | Runs still running or queued right now. |
| Tests | How many distinct tests were exercised. |
| Tested issues | How many distinct Jira issues those runs covered. |
| Avg duration | How long an average run took. |
Narrow it down
Four filters sit above the reports, and every tile and chart on the page responds to them together:
- Date range — 7d, 30d, 90d, or All.
- Status — passed, failed, errored, cancelled, running, or queued.
- Source — BDD, Freeform, or Manual, so you can separate agent-run results from results someone recorded by hand.
- Agent — narrow to runs executed by one AI agent, when your team uses more than one.
The eight reports
| Report | What it answers |
|---|---|
| Outcome breakdown | How the period split across passed / failed / errored / cancelled — as a donut. |
| Outcome trend | Whether things are getting better or worse, as stacked bars over time. The bucket size adapts to the period you picked. |
| Most-failed tests | Your worst offenders, ranked by fail count, with each one's fail rate — the shortlist worth fixing first. |
| Failure analysis | Failures grouped by category — so you can tell a genuinely failing assertion from a timeout or a setup problem. |
| Most-run tests | What you exercise most, by run count. |
| By source & agent | How runs divide between BDD, free-form, and manual results — and which agent executed them. |
| Coverage | How much of the project actually has tests behind it, so you can see the gaps. |
| Plan outcomes | How your Test Plans have been faring across their runs. |
Take the data with you
- ⬇ CSV on any report downloads exactly what that card is showing — already narrowed by your filters — for a spreadsheet or a status report.
- ⬇ Export CSV at the top-right of the filter bar exports the whole filtered run set in one file, rather than a single card's table.
- View in Run History → at the foot of several cards jumps you to Run History so you can open the underlying runs and see what actually happened.
Most-failed tests ranks by raw fail count, so a test you run constantly can out-rank a rarely-run test that fails every time — check the fail rate beside it before deciding what to fix. And when failures cluster under Failure analysis as timeouts or setup errors rather than assertions, the problem is usually the environment, not the tests.
12 Review the results
When a run finishes, its card fills in with everything you need to understand what happened — the per-step outcome, evidence, screenshots, and an audit trail.
A passing run
A green Passed run shows every step with a checkmark and how long each took. The editor's run pill reads, for example, "Passed · 3/3 steps · 2m 58s." The first time a test ever passes, you'll get a little "Test passed for the first time!" celebration.
A failing run
A red Failed run pinpoints the exact step that failed and shows the evidence the agent gathered:
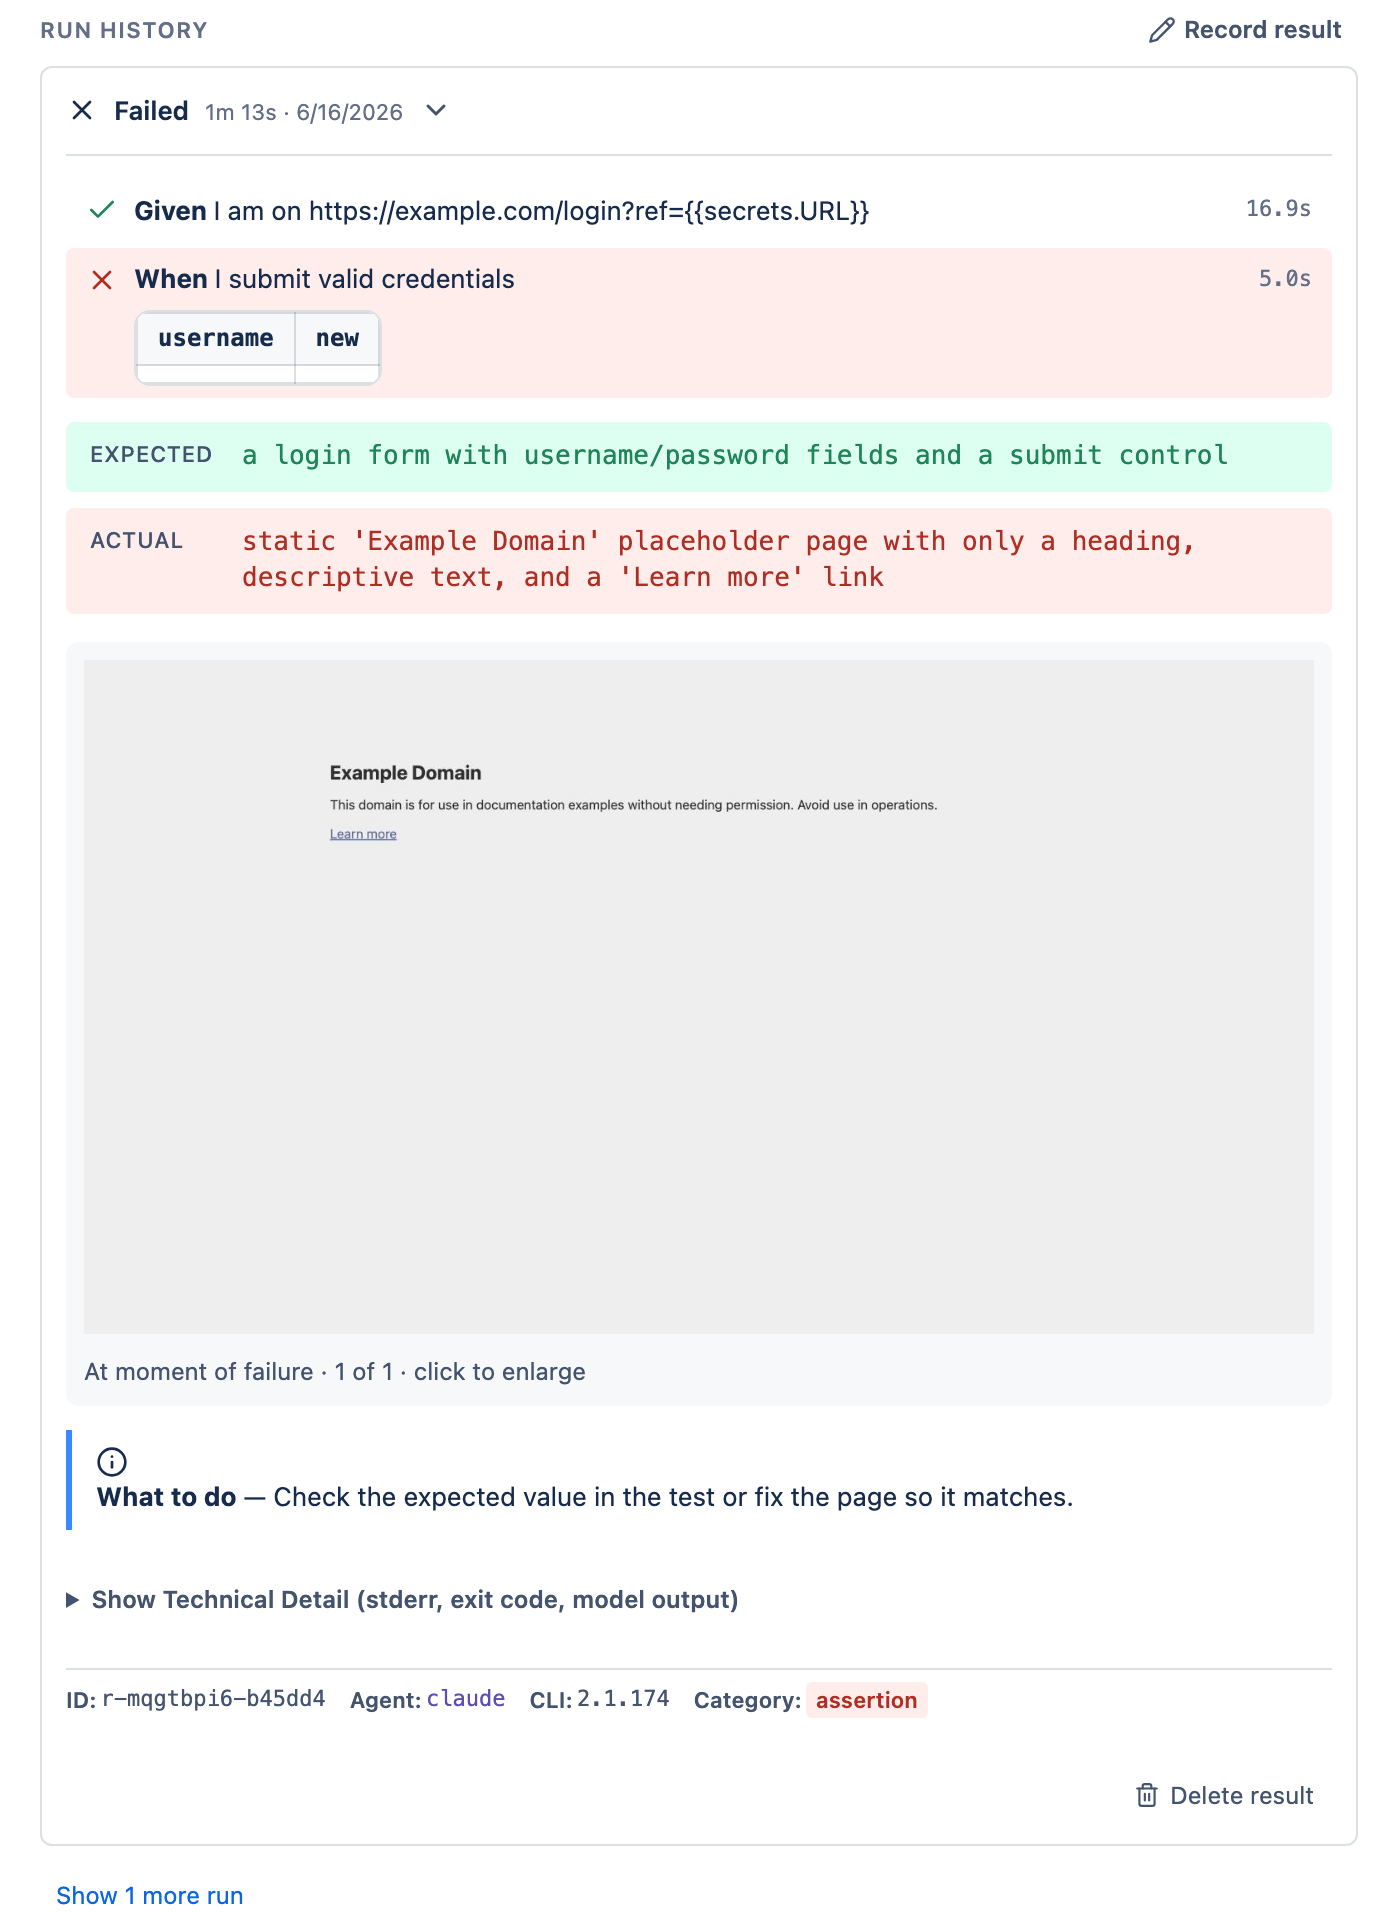
- Step checklist — steps before the failure are ticked; the failing step is marked with a red ✗; later steps are skipped (they were never reached).
- Expected vs Actual — what the test was looking for versus what actually happened.
- What to do — a suggested fix written by the agent.
- Screenshots — when the agent captured the screen, a screenshot of the moment of failure appears; click it to enlarge and step through any others.
- Audit footer — the run ID, which Agent/Model ran it, the agent's CLI version, and a failure category (e.g.
assertion_failed,timeout).
Errored means the run couldn't complete (a crash, timeout, or setup problem) rather than a test that genuinely failed — the card explains what to fix. Cancelled means someone pressed Stop Run.
Run history
Recent runs are kept (the panel shows the latest 10; your computer keeps the full history under Activity). The most recent is shown expanded; click Show N more runs to review older ones.
Recording a result by hand
You can Record a result manually (Pass or Fail, with optional screenshots) from a test's run history without running on a paired computer — useful when you have no paired computer or are reviewing evidence gathered elsewhere. Manual runs are marked Manual to distinguish them from agent-executed runs. This works the same from the issue panel and the Library drawer.
A run tied to an issue posts its verdict and evidence to that issue, as above. An issue-less run has no issue to post to, so its result appears in the test's run log — in the Library drawer and in project Run History. Screenshots from issue-less runs can be stored in Confluence if your admin turns that on (section 13); otherwise they're discarded, and the run still records its verdict.
13 Store screenshots in Confluence
A run tied to a Jira issue attaches its screenshots to that issue. An issue-less run has no issue to attach to — so, if you'd like to keep its screenshots, VibeTest can save them to a Confluence space instead. This is optional and off by default.
Turn it on (project admin)
Screenshot storage is a per-project setting on the VibeTest settings page — the same page you pair from. In Jira, go to Project settings → Apps → VibeTest by AppDash, scroll to Screenshot storage (Confluence), and:
- Pick a space. Choose a Confluence space from the dropdown — you'll only see spaces you can access. Leaving it on "Off — discard issue-less screenshots" keeps the feature disabled.
- Optionally, pick a parent page. Paste a Confluence page ID or page URL to nest the run pages under it. Leave it blank for one container per project at the space root.
- Save. The status then reads On and "Storing in <space>."
Because this feature writes to Confluence, the app needs a few Confluence permissions in addition to its Jira ones (listed in Security & privacy). Enabling it may prompt your Jira admin to approve those scopes. On a Jira-only site — or with the feature off — the Confluence permissions stay dormant and nothing is written.
What gets stored
- Each issue-less run that captures screenshots gets one Confluence page, holding that run's screenshots, under the space (and parent) you chose. The page links back to the test in the Library.
- Screenshots render inline in the Library run history. They're fetched as the person viewing, so a space-restricted image is only visible to someone who could already read it in Confluence.
- Deleting a test or a run best-effort removes its Confluence page too.
- Issue-linked runs are unaffected — their screenshots still attach to the Jira issue.
14 Use the desktop app
Most of the time AppDash AI Link just runs quietly in your menu bar (macOS) or system tray (Windows). When you want to check on it, its four tabs cover connections, run history, low-level logs, and settings.
Connections — your paired sites
The Connections tab (shown in section 3) lists every paired Jira site under Sites, each as a card with a live status dot. Expand a card for its actions:
- Test — run a quick connectivity check against that site.
- Jobs — jump to the Activity tab filtered to this site.
- Network log — jump to the Console tab filtered to this site.
- Pause / Resume — temporarily stop (or restart) listening for that site.
- Remove — unpair the site and delete its locally stored tokens (this can't be undone — you'd re-pair to reconnect).
Activity — your run history
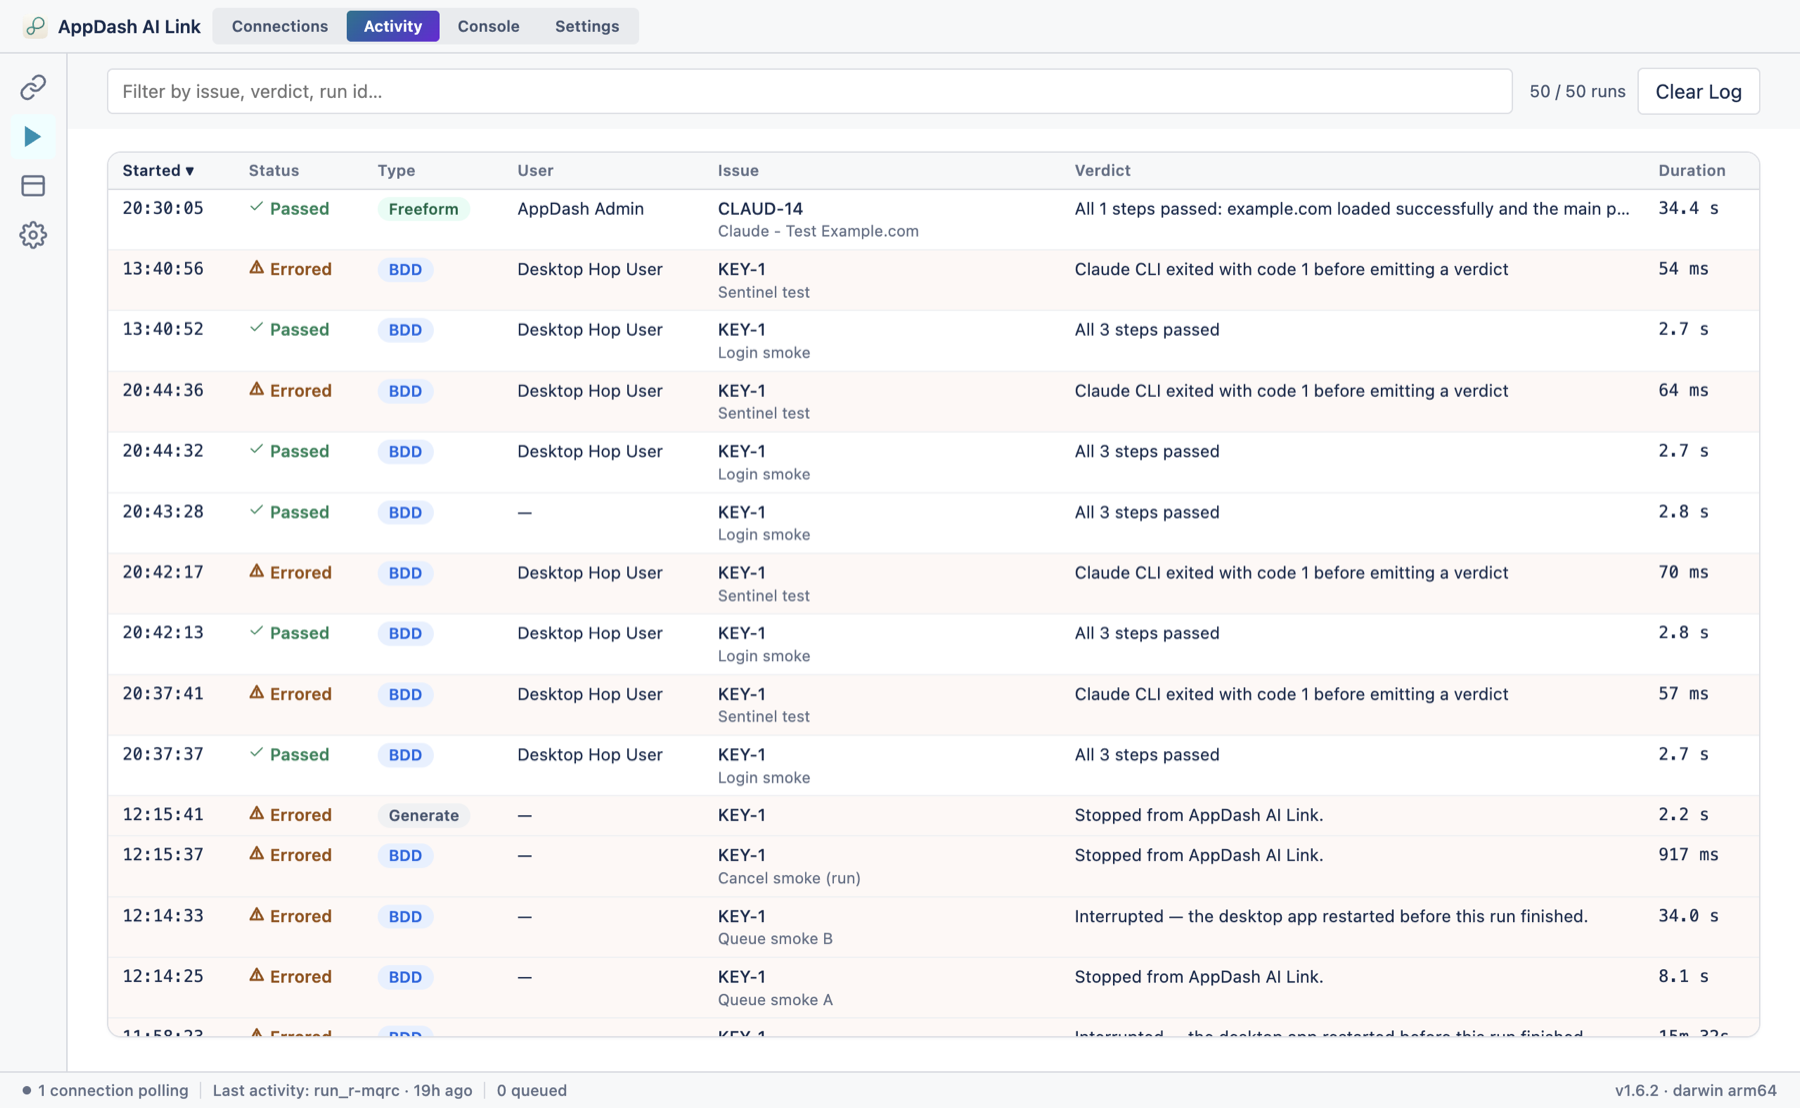
The Activity tab is a searchable table of every test run this computer has executed: when it started, its status, type, who triggered it, the issue, the verdict, and how long it took (a Source column also appears once you have more than one connection). Click a row for the full detail, including the step list and the agent's transcript. While a run is still in progress, open it and click Stop to cancel it — the run is stopped and recorded as cancelled in Jira. Use Clear Log to empty the table.
Console — the technical log
The Console tab is for diagnosing problems. It has three sub-views in a left list: Network log (the app's HTTP calls to Jira, agent subprocess launches, and pairing messages — colour-coded by success or error; routine background "heartbeat" polls are hidden by default, use the Show menu to reveal them; click a row to inspect the full request and response, or a run's launch to read its conversation), Audit log (the server-side security ledger for your Atlassian connections — pairings, token rotations, scope checks), and Events (a local record of actions on this computer — pausing/resuming connections, settings changes, sleep/wake).
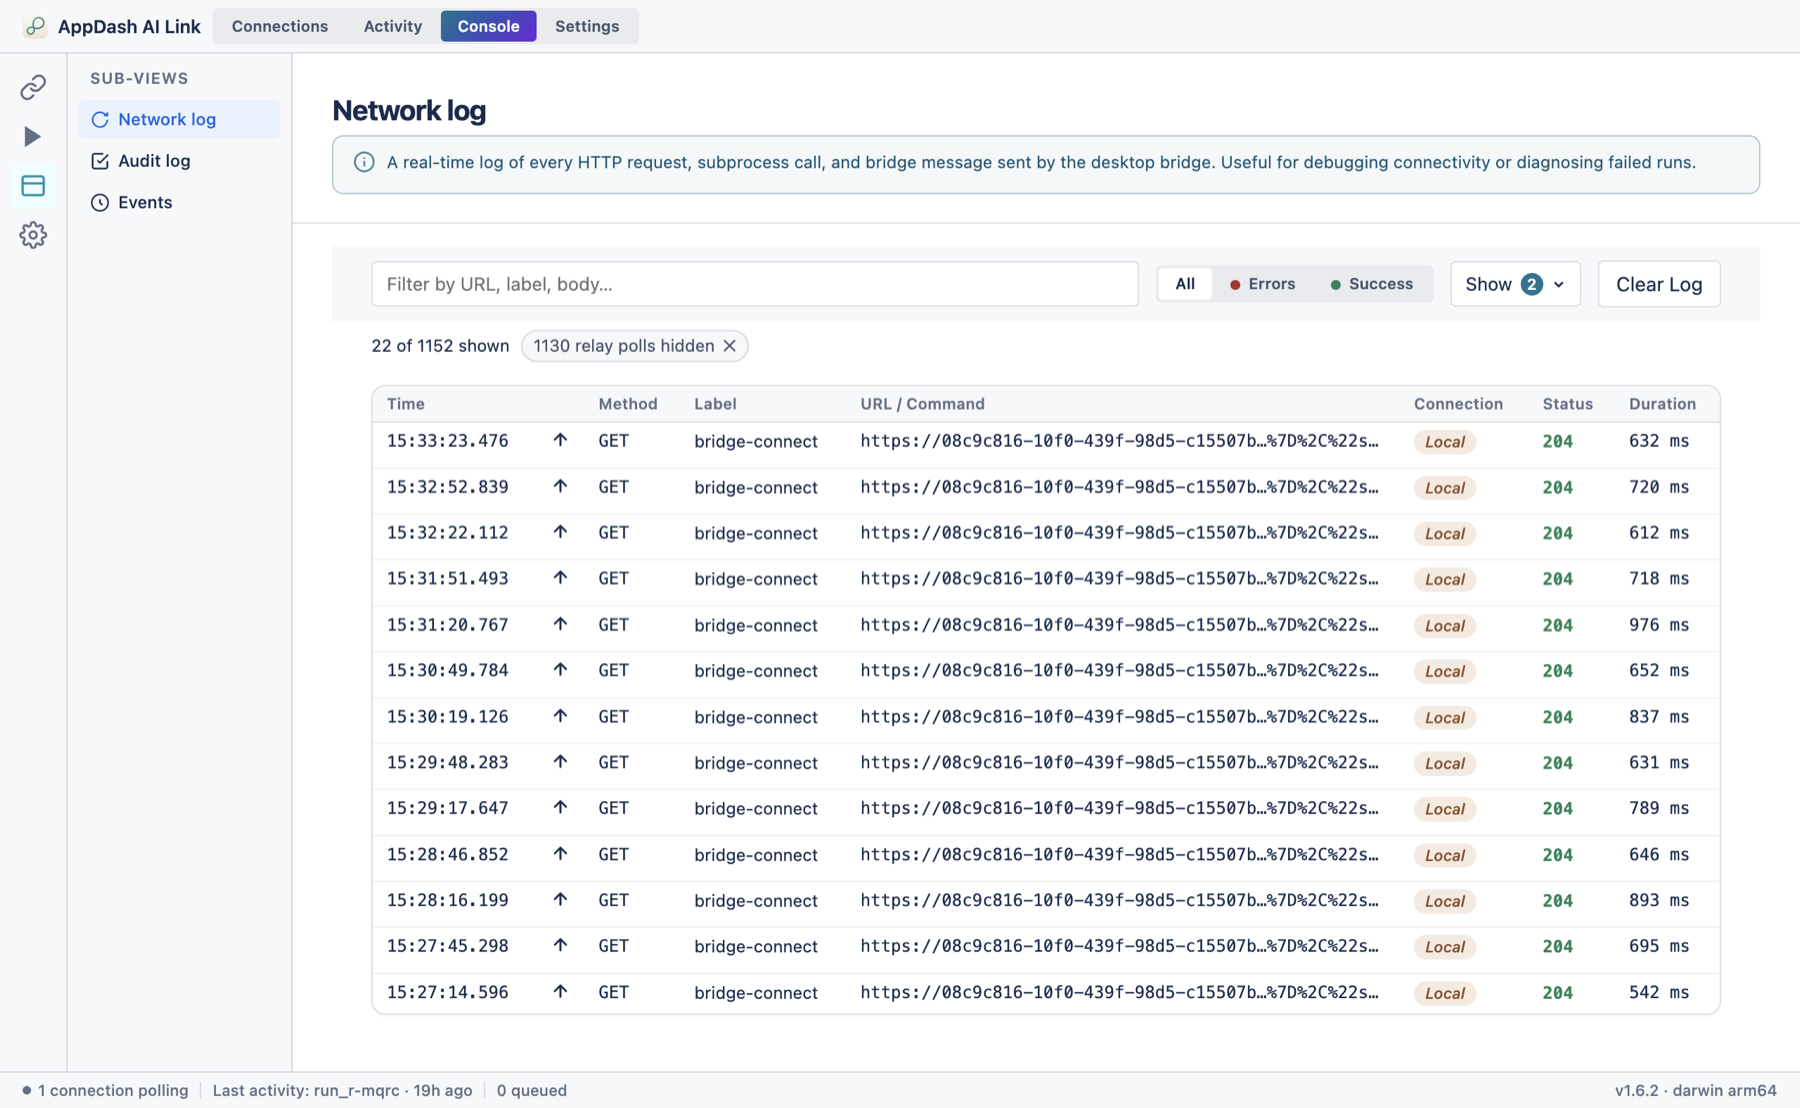
Settings — agents and preferences
The Settings tab opens on Agents, where you choose and configure the agent that runs your tests.
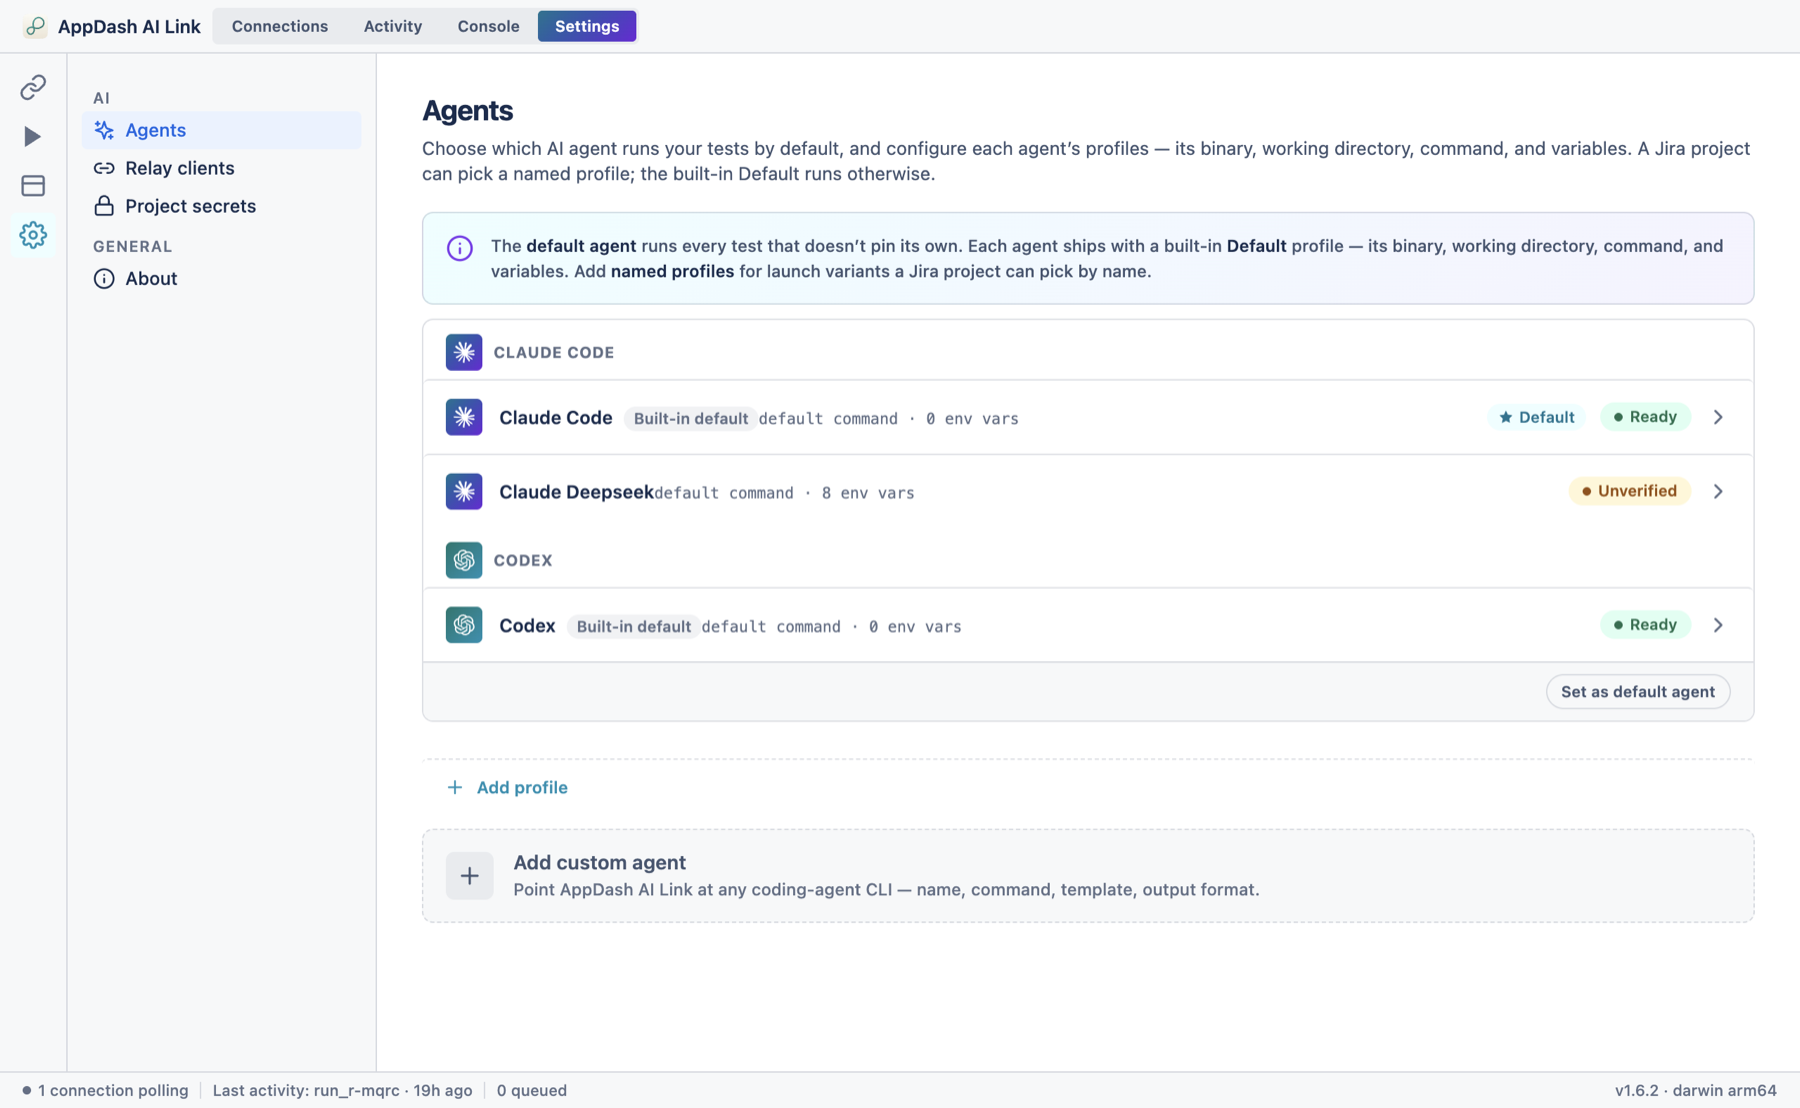
- Default agent — the agent used for any run that doesn't pin its own (Claude Code out of the box). Click Set as default agent on a healthy agent to switch.
- Profiles — each agent ships with a built-in Default profile and can have any number of named profiles. A test in Jira can pin a named profile by name; the Default runs otherwise.
- Add custom agent — point AppDash AI Link at any coding-agent CLI (name, command, output format, launch template).
- Open a profile (the › arrow) to configure it: its binary (auto-detected, Re-detect, or Browse), an optional working directory (blank = a fresh sandbox each run; a real path lets the agent touch project files), the launch command template, per-profile environment variables (which can be marked secret), advanced timeouts, a live command preview, and a Test connection button.
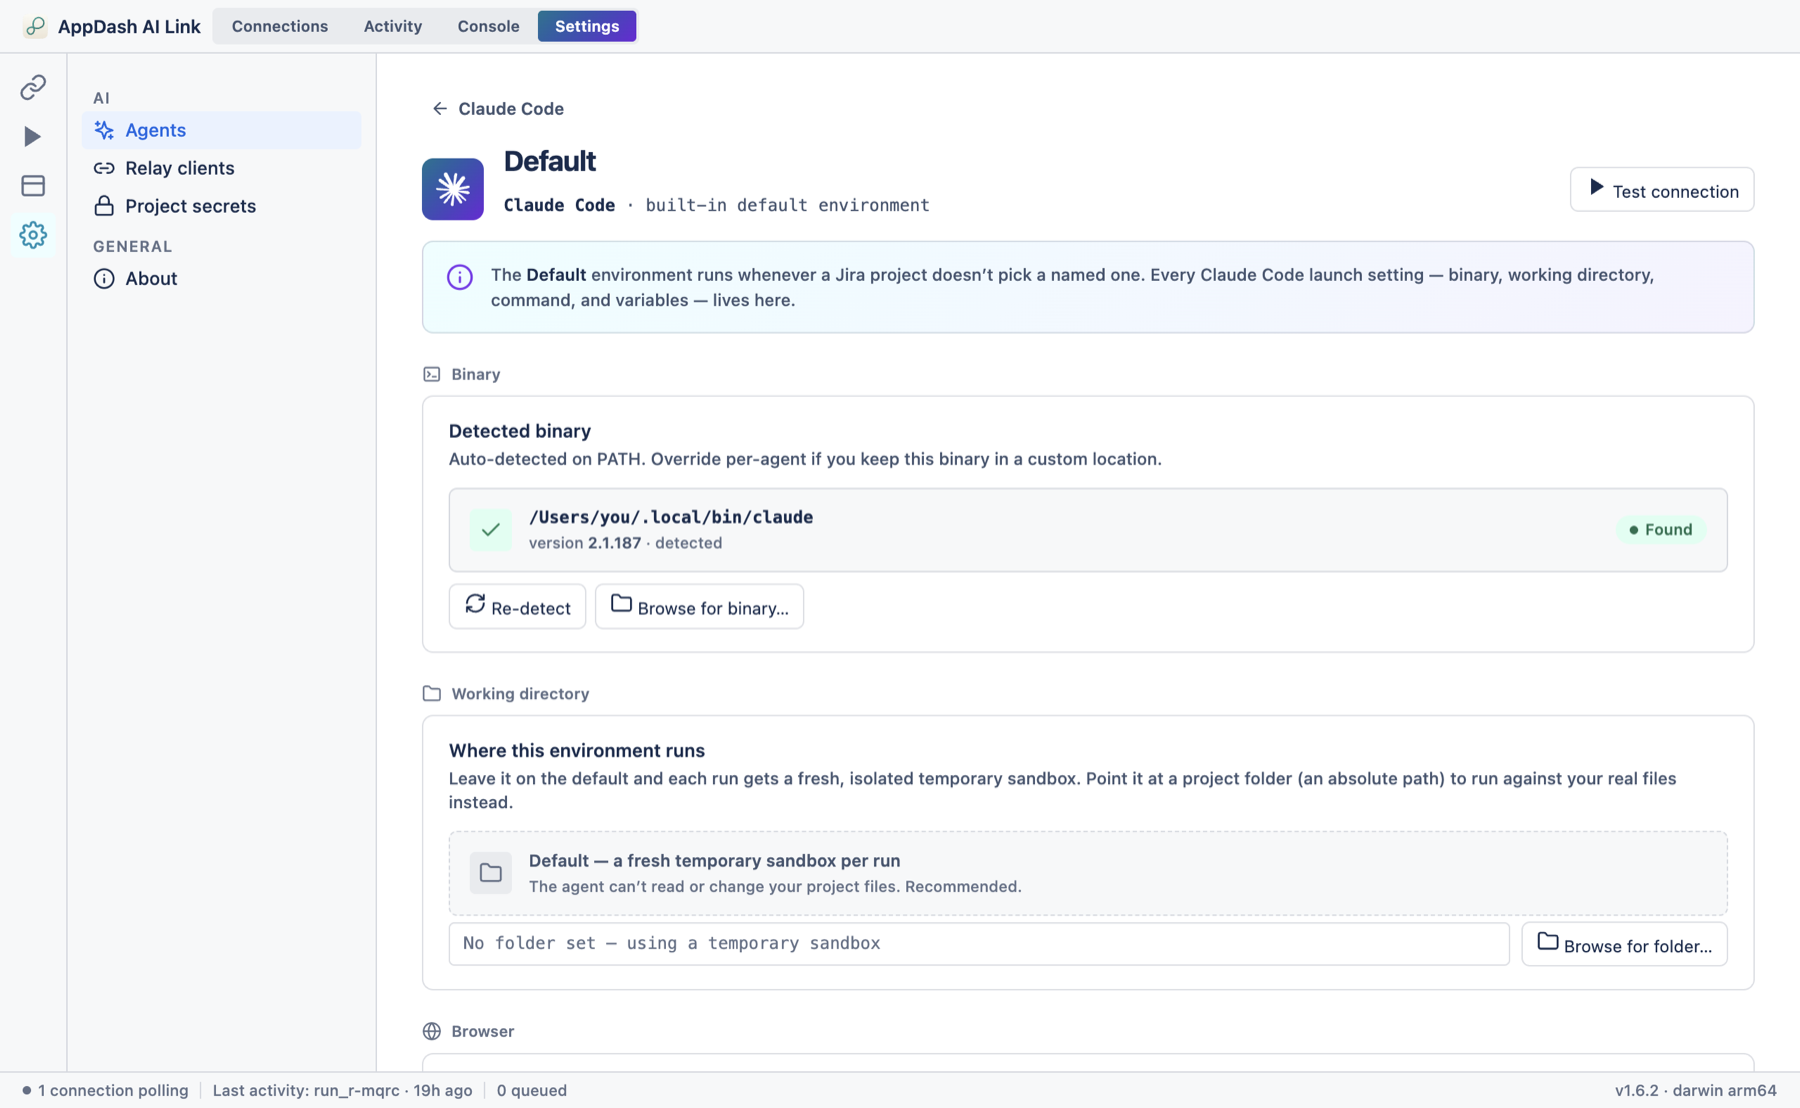
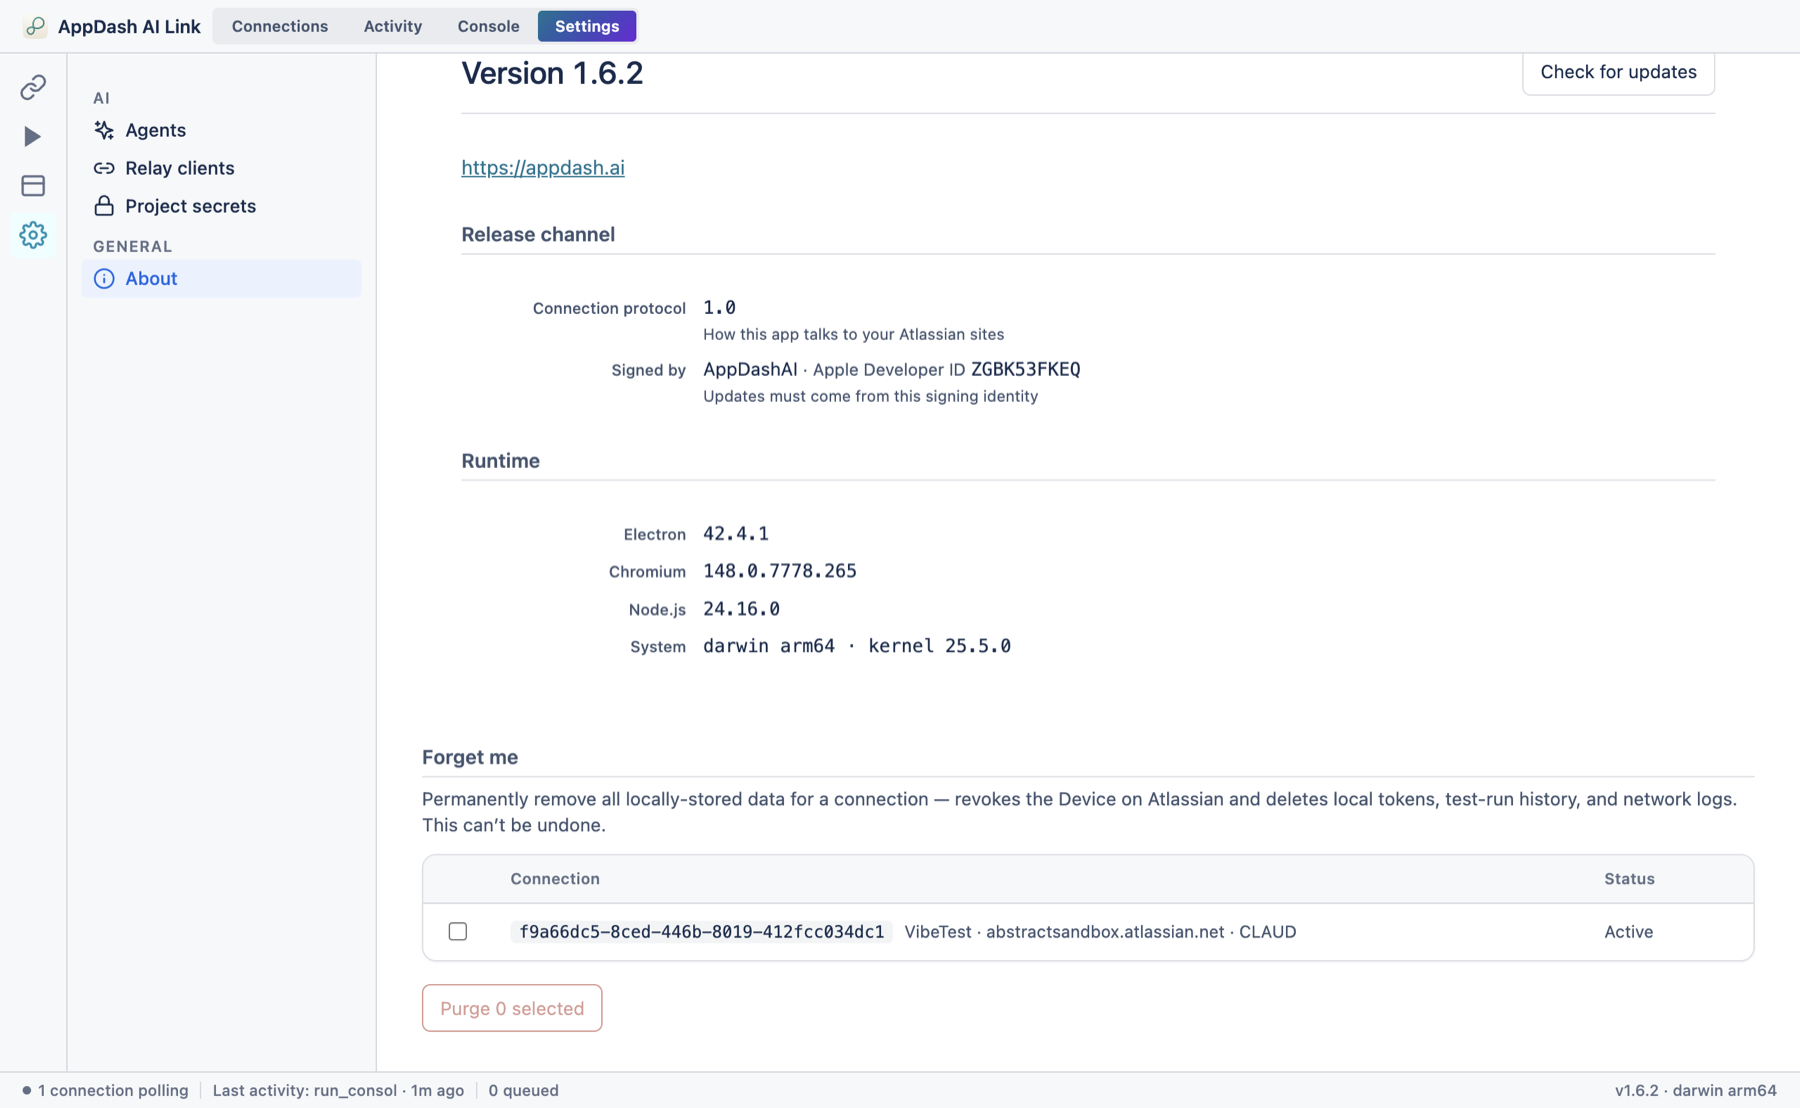
Other items in the Settings sidebar: Relay clients (pair an iPhone for read-only status checks — off by default), Project secrets (store credentials for your tests — see section 15), and About (version, update check, and the Forget me data-erasure wizard at the bottom).
Your Jira project settings page (the one you pair from) carries two project-wide choices that complement the desktop: a Test environment picker — which of your agent's named environments this project's tests run against — and a Generation prompt that steers how Generate with AI writes tests for the project. Both save together with a single Save settings.
15 Use secrets in your tests
Real tests often need a password, an API token, or an internal URL — and you don't want those typed into the test, which is stored in Jira. Secrets solve this: store the value once on your computer, give it a name, and reference it in a step as {{secrets.NAME}}. Your computer swaps in the real value at run time, so Jira only ever sees the name.
How a secret flows
A secret's value never leaves your computer — only its name travels to Jira, so the editor can offer it as a suggestion:
STD_PW = the real password in the desktop app. It goes into your OS credential store — the macOS Keychain or Windows Credential Manager.{{secrets.STD_PW}} in a step. That placeholder is what Jira stores.The secret value lives only in your computer's credential store, and is used only in memory while a test runs. It is never written into the test, never sent to Jira or AppDash, and — as you'll see below — actively stripped out of the results that come back. Jira stores only the {{secrets.NAME}} placeholder and the secret's name.
Step 1 · Store the secret on your computer
Secrets live in the desktop app, grouped by Jira project. Open AppDash AI Link, go to the Settings tab, and choose Project secrets from the sidebar (under AI).
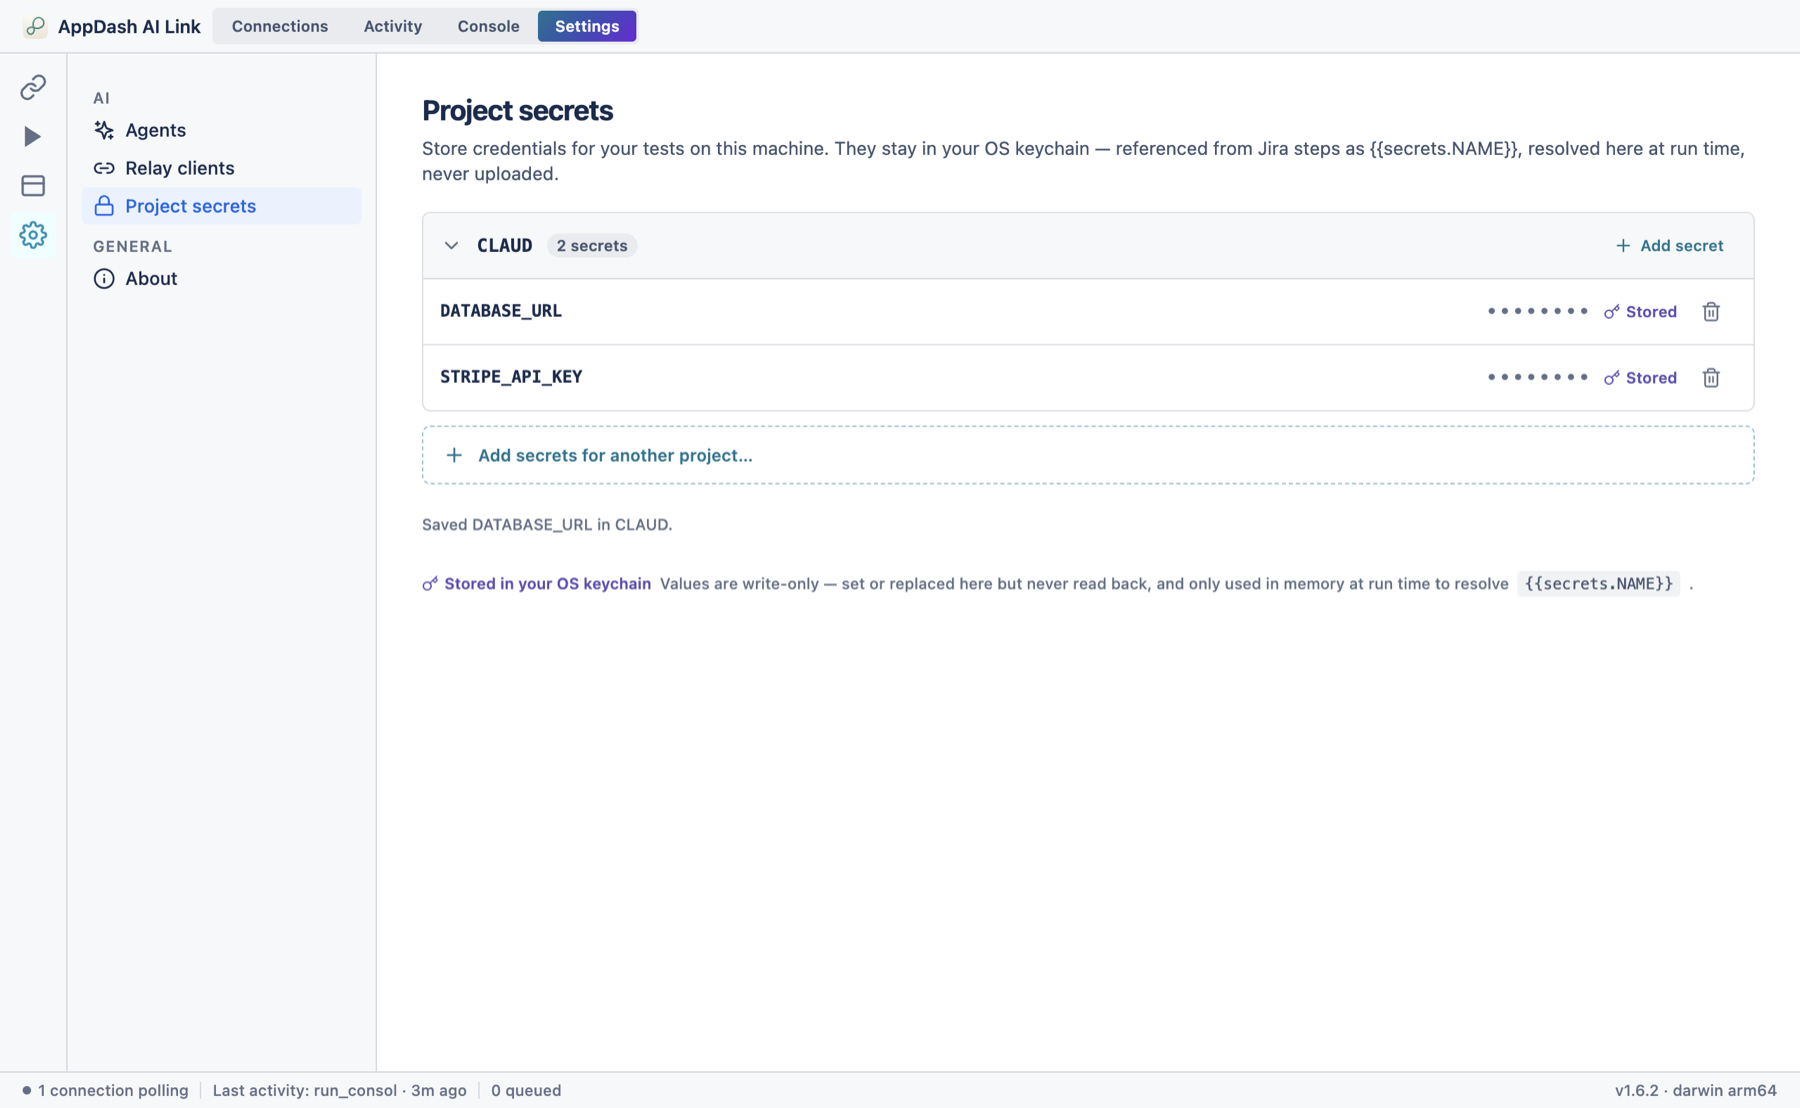
- Open the Add-secret form. Click Add secret on a project's group, or Add secrets for another project… at the bottom to start a brand-new project.
-
Name it and paste the value.
Give the secret a name — letters, digits, hyphens, and underscores, e.g.
STD_PW— and paste its value into the masked field. Click Add. The value is written straight to your credential store.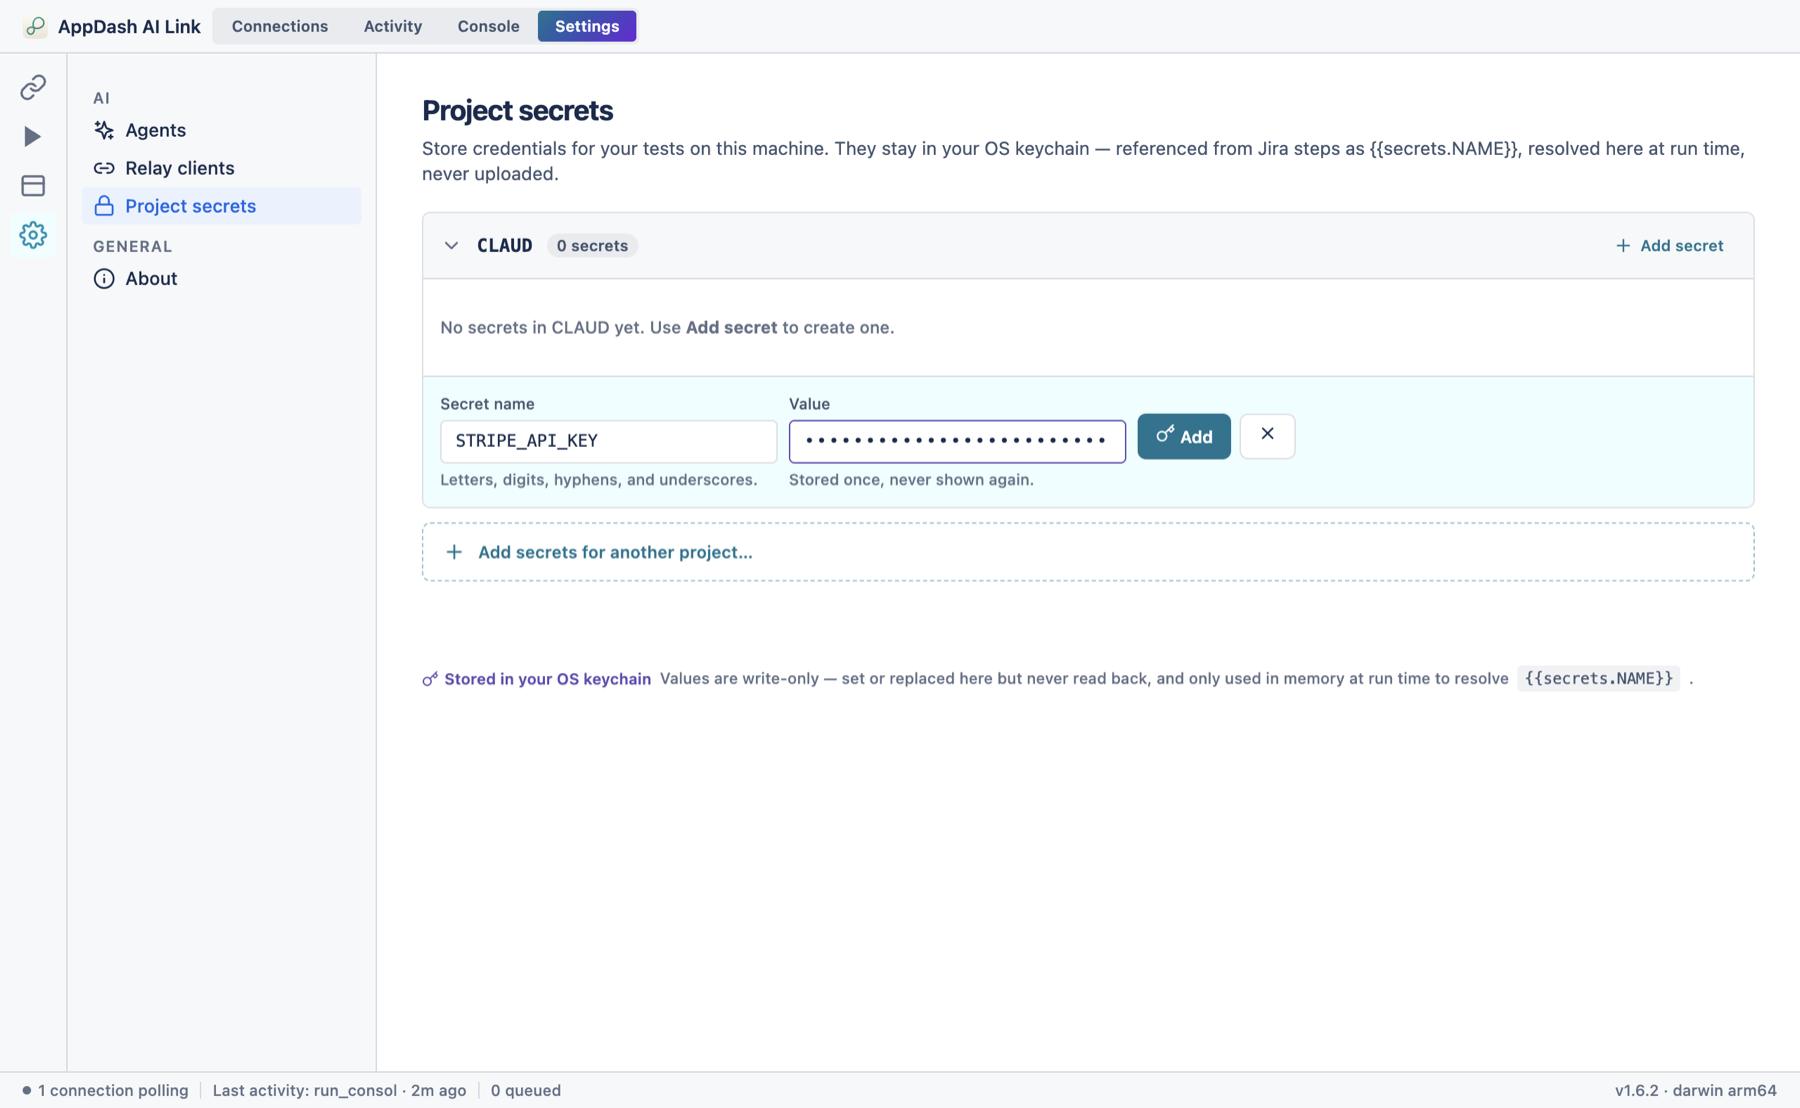
Adding a secret. The value field is masked, and once saved it's write-only — stored in your credential store and never shown again, even to you. -
Match the project key.
A secret is scoped to one Jira project key — the prefix of your issue keys (the
ENGinENG-123). A test on anENGissue can only use secrets stored underENG, so when you add secrets for a new project, type that exact key in the Project key field.
For safety a stored value can never be read back — not by the app, not by you. To change it, add the secret again with the same name and the new value replaces the old. To remove it, click the trash icon and confirm; the value is erased from your credential store and can't be recovered.
Step 2 · Reference it in a Jira test
In the BDD editor, type {{ in any step body and an autocomplete list of your project's secret names appears. Pick one to insert a complete {{secrets.NAME}}. Secrets resolve in both test types — BDD steps and Free-Form Task fields (the Task and Success-criteria boxes).
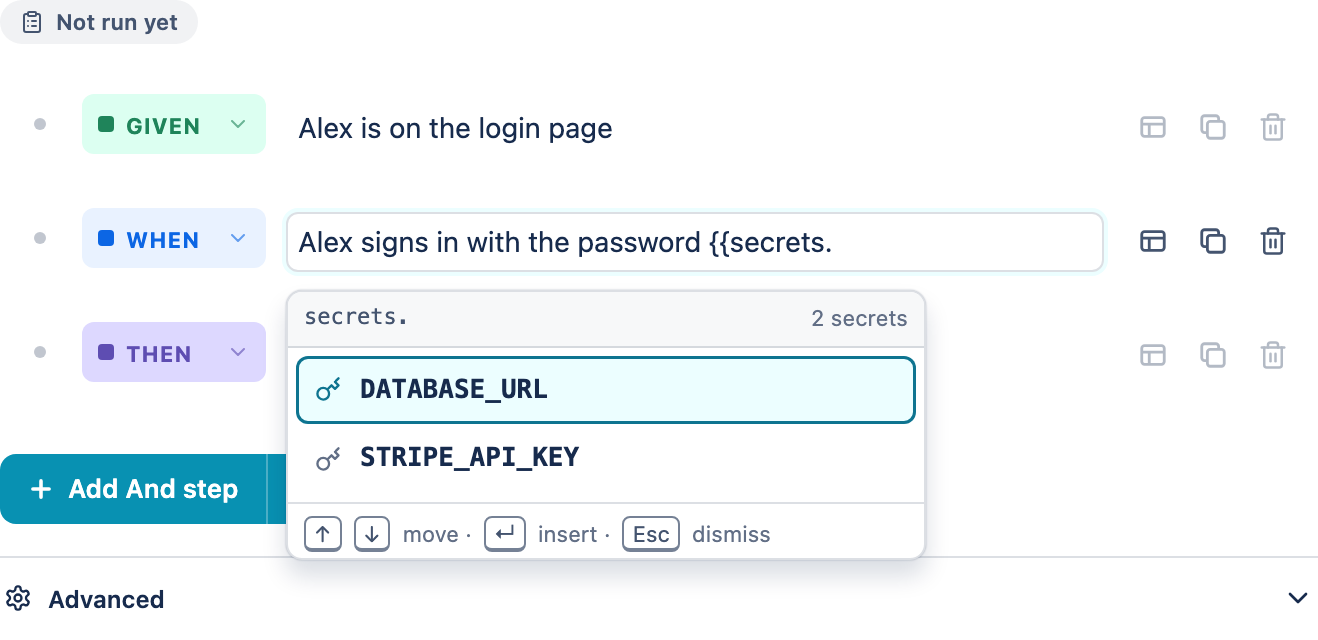
{{ opens the names stored for this issue's project across your paired computers. Type to filter; ↑↓ move, ↵ inserts, Esc dismisses.A step that references a secret is tagged with a small secret badge (a shield), so it's easy to see which steps depend on a stored value. The suggested names are the union from every computer paired to this project — so you can reference a teammate's secret too; it simply resolves on whichever computer runs the test.
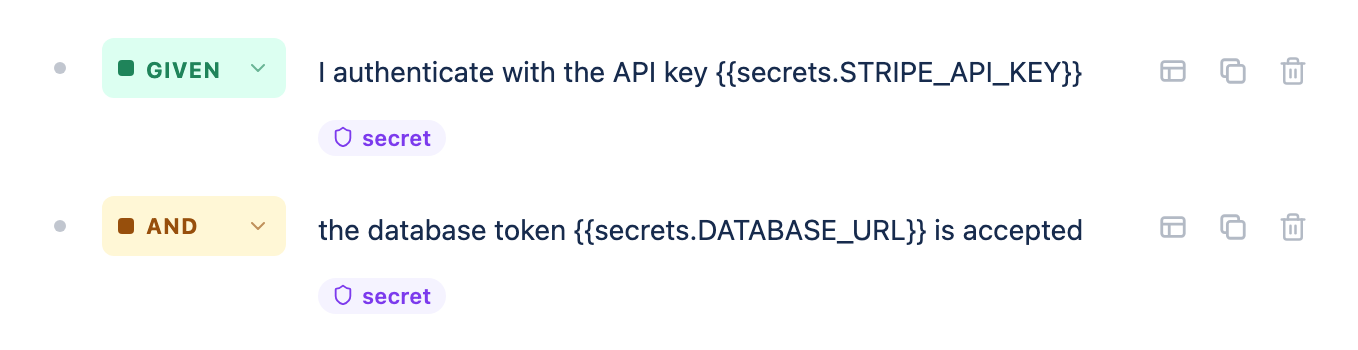
{{secrets.NAME}} is tagged. Reference a name the project doesn't recognise and an advisory note appears — it won't block saving, but the run only succeeds if a paired computer actually defines that secret.What happens when the test runs
The moment you press Run test, three things happen on your computer — never in the cloud:
- Resolve. Just before launching the agent, your computer looks up each
{{secrets.NAME}}in the credential store (for the issue's project) and swaps in the real value. The agent runs against the real credentials. - Fail closed. If a referenced secret isn't stored on the computer running the test, the run doesn't proceed with a blank — it comes back Errored with a secret-resolution message naming what's missing. Add the secret and run again.
- Redact. The agent's output can echo a value back (say, printing a URL it fetched). Before any result leaves your computer, every resolved value is replaced with its
{{secrets.NAME}}placeholder — across step messages, the verdict, and failure detail alike — so it can't surface in a Jira comment, the panel, or the run history.
Because both the resolve and the redact steps run on your computer, a secret value exists in exactly one place — your OS credential store — plus briefly in memory during a run. Jira and AppDash never receive it. (One minor limit: very short values, under four characters, aren't masked in echoed output — no realistic password, token, or URL is that short.)
Manage your secrets
| Task | How |
|---|---|
| Update a value | Add the secret again with the same name — the new value replaces the old. (You can't view the old one.) |
| Delete a secret | Click the trash icon beside it and confirm. It's removed from your credential store permanently; tests that reference it will error until you re-add it. |
| See what's stored | The Project secrets panel lists every project and name you hold. Values are never shown — only that each is Stored. |
| Share across a team | Each teammate stores the same-named secret on their own computer under the same project key. The test references the name; whoever runs it resolves it locally. |
Anywhere you'd otherwise type a password or token — a login step, a data-table cell, an API call — use {{secrets.NAME}} instead. The test stays shareable and reviewable in Jira, and the sensitive part lives only on the machine that runs it.
16 Security & privacy
VibeTest is built so that your most sensitive assets — source code, credentials, and customer data — never leave your control. This section summarises the architecture and controls a corporate security review typically asks about.
Where your data lives
There are only two places VibeTest keeps anything, and you own both of them:
In the configuration described in this guide, your test data flows only between your Jira site and your paired computer. The vendor (AppDash) operates no backend that receives your code, credentials, or test data — so there is no third-party copy of your information to breach, subpoena, or mishandle.
Security controls at a glance
A reviewer-friendly summary of how VibeTest handles the questions that come up most often:
| Control area | How VibeTest handles it |
|---|---|
| Data residency | Test definitions and results are stored in Atlassian Cloud storage inside your own Jira Cloud tenant. Screenshots attach to the Jira issue (issue-linked runs) or, if you enable it, to your own Confluence space (issue-less runs); agent transcripts stay on your computer. |
| Data in transit | HTTPS/TLS everywhere. The Jira app's endpoints are TLS-only; the desktop app reaches them over HTTPS. |
| Data at rest | Atlassian encrypts the stored app data at rest. On the desktop, access tokens and secrets are held in the OS credential store — the macOS Keychain or Windows Credential Manager (both OS-encrypted) — not in plain files. |
| Third-party backend | None in this configuration. The Jira app declares no external-fetch permission, so it cannot send your data to any outside server. |
| Authentication | Each connection has its own scoped tokens. Pairing is a mutual challenge–response with a time-limited code and an app fingerprint that you confirm on both Jira and the desktop, so a connection is created only with your explicit approval on each side. |
| Least privilege | The app requests a small, standard set of Jira scopes (listed below) and nothing more. The authoritative scope list is shown to your admin at install/consent. |
| Network exposure | For the test-running workflow, the desktop app is outbound-only — it polls your Jira site over HTTPS. It needs no inbound ports, port-forwarding, or firewall changes. |
| Source & credential isolation | Your repository, logins, internal URLs, and secrets are used by the local agent and are never sent to Jira or AppDash. Jira receives only the verdict, step outcomes, and the evidence you see in the panel. |
| Auditability | Atlassian keeps an audit trail of bridge activity; the desktop app records every run (Activity) and every network and subprocess call (Console). |
| Revocation & erasure | Unpair a site to delete its local tokens, revoke a connection from Jira, or use Settings → About → Forget me to wipe all locally stored data at once. |
| Software integrity | The macOS app is code-signed and notarised by Apple; the Windows installer is code-signed with an Azure Trusted Signing certificate. Each platform has its own signed auto-update feed. A minimum-version gate retires outdated clients from the bridge. |
Jira permissions (scopes) the app requests
VibeTest asks for only what it needs to read issues, post results, and store its own data — five Jira scopes:
| Scope | Why it's needed |
|---|---|
read:jira-work | Read the issue a test belongs to, for context during a run. |
write:jira-work | Post test results and evidence back onto the issue. |
storage:app | Store the app's own data (tests, runs, connection records) in Atlassian Cloud storage. |
read:jira-user | Resolve the display name of whoever last saved a test, for attribution. |
report:personal-data | Report the account IDs the app stores to Atlassian's privacy service, so personal-data deletion requests are honoured (a Marketplace GDPR requirement). It enables no external network access. |
Confluence permissions — only for optional screenshot storage
If a project turns on Confluence screenshot storage (section 13), the app also needs a set of Confluence scopes to write and read those pages. They are dormant unless the feature is enabled, and a Jira-only site never exercises them. Enabling the feature may prompt your Jira admin to approve these:
| Scope | Why it's needed |
|---|---|
write:page:confluence | Create the per-project container page and one page per issue-less run. |
read:page:confluence | Read a page's current version before updating it. |
write:attachment:confluence | Upload each screenshot as an attachment on the run's page. |
read:content-details:confluence | List a page's attachments when rendering a run's screenshots. |
read:attachment:confluence | Download screenshot bytes to display them — done as the viewing user, so nobody sees an image they couldn't already read. |
read:space:confluence | List and validate the spaces an admin can pick from. |
delete:page:confluence | Delete a run's page (and its screenshots) when the run or test is deleted. |
The Jira side runs on Atlassian's hosted runtime
The Jira side of VibeTest runs entirely inside Atlassian's hosted, sandboxed runtime, with per-tenant data isolation and Atlassian-managed encryption — there is no separate AppDash-hosted cloud to assess. (The test-execution agent runs on your own computer, not on Atlassian — so the product as a whole is not an Atlassian "Runs on Atlassian" app; this section describes only the Jira-hosted half.) For Atlassian's platform certifications, sub-processors, and data-residency options, point your reviewers to the Atlassian Trust Center and the app's Marketplace listing.
Most reviews are satisfied by four facts from this page: (1) the data-flow diagram above — data stays between your Atlassian tenant and your computer; (2) the app requests a small set of Jira scopes (plus, only when Confluence screenshot storage is enabled, the Confluence scopes listed); (3) there is no third-party backend and no external-fetch permission; and (4) tokens and secrets are held in the OS credential store (macOS Keychain / Windows Credential Manager) and can be erased at any time. Pair that with the Atlassian Trust Center for the underlying platform.
Your responsibilities
Because tests run on your machine with your agent, a few things stay in your hands:
- Protect the machine. Anyone with access to the paired computer can run tests against the connected site. Use full-disk encryption (FileVault on macOS, BitLocker on Windows) and a screen lock.
- Mind what a test can reach. The agent runs with your local permissions and logins. Review scenarios that touch production systems, and prefer non-production accounts where you can.
- Use secrets, not plain text. Reference credentials with
{{secrets.NAME}}(see Use secrets in your tests) so they aren't written into the test definition stored in Jira.
17 Troubleshooting
Most issues come down to a connection that needs attention or the desktop app not running. Start with the status dot on the Connections tab.
Connection statuses and what to do
| Status | What it means | What to do |
|---|---|---|
| Polling | Healthy — listening to Jira for test runs. | Nothing. This is the normal state. |
| Idle | Registered but not actively polling right now. | Nothing; runs still arrive within seconds. |
| Running | A test is executing on your computer right now. | Wait for it to finish. |
| Retrying | A temporary network or server hiccup; it will retry automatically. | Usually self-heals. If it persists, check your internet. |
| Auth failed | The stored access tokens expired or were revoked. | Re-pair the site from Jira (use the Re-pair button on the card). |
| Paused | You paused polling for this site. | Click Resume on the card. |
| Update required | The desktop app is too old for the current bridge. | Update AppDash AI Link (Settings → About → Check for updates). |
Check the wiring: Test connection
To confirm your computer can reach the AI agent, open Settings → Agents, select your agent environment, and click Test connection. It runs a tiny PONG prompt through the agent's full launch path. A "Ready ✓" result (with the round-trip time) means the desktop-to-agent link works; a "Failed" result points at an agent that isn't installed or configured — re-check the environment's command and binary path on the same screen.
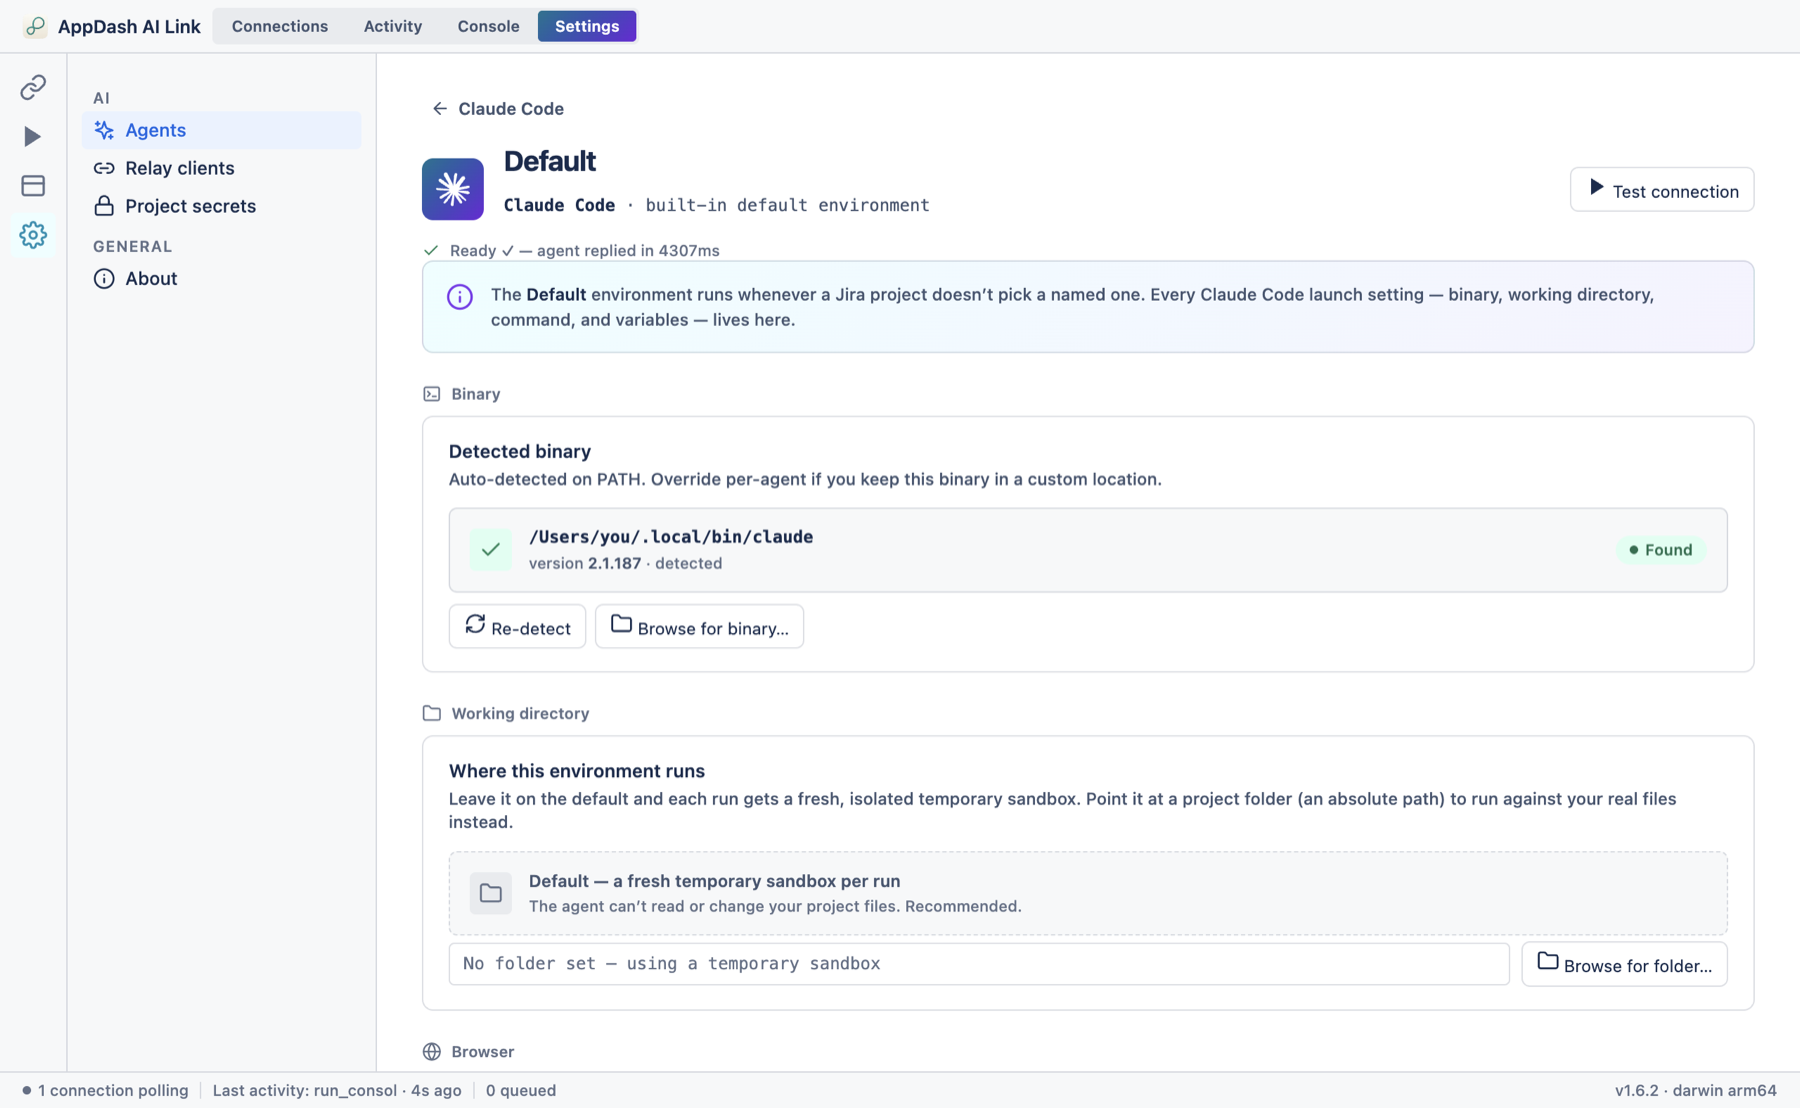
Common problems
| Symptom | Likely cause & fix |
|---|---|
| Run comes back "No paired desktop device" | Your computer isn't paired, or the app isn't running. Open AppDash AI Link and confirm the site shows Polling; pair it if it's missing (section 4). |
| Runs never start (stay Queued) | The desktop app may be fully quit, or the connection is paused. Open AppDash AI Link (it keeps polling in the tray even when the window is closed, but not after you Quit it), and check the site isn't Paused — click Resume if it is. |
| Card shows Auth failed or "token missing" | Re-pair the site from Jira. Tokens expire over time; re-pairing issues fresh ones. |
| A test failed with a "site blocked" message | The browser extension limits which sites the agent may visit. Add the target site to the allowlist as the run card suggests. |
| Pairing won't complete | The link expired (they're valid only a few minutes) — generate a new one in Jira. Confirm the code/fingerprint match on both sides. |
| A Library test won't run — "update required" | Running a test with no linked issue needs a recent AppDash AI Link. Update it (Settings → About → Check for updates) and run again. Runs tied to an issue work on any paired version. |
| A run sits Queued on the Live tab | The Live tab names why — the desktop is offline, paused, or busy on another project's plan. Open AppDash AI Link (and Resume it if paused); the run starts once the computer is free. |
For a deeper look, the Console tab shows the exact requests and errors, and its Pair history sub-view records why past pairings succeeded or failed.
Privacy: erase everything
Everything VibeTest stores on your computer — connections, tokens, activity, and logs — lives there, not in the cloud. To wipe it all, open Settings → About → Forget me and confirm. This permanently deletes the local data and unpairs your sites.
Confirm all four are true: the desktop app is open, the site shows Polling, the Test connection check passes, and your AI agent is installed. That covers the large majority of issues. If a problem persists, the Console tab and Settings → About (for the version) are the details to share when you report it.